You run a diagnostic lab, or you build its pipelines. Somatic variants in tumours, fusions in RNA, splice variants in a child with a suspected inherited disorder, pathogens in cerebrospinal fluid, cancer signals in plasma. Every month brings another genomic foundation model with a strong benchmark table. Which ones should you actually use?
I went through the published evidence for eight diagnostic tasks to find out. For five of them, I found no foundation model evaluated at all. For two more, the only tests are weak: one was run by the model's developers, and the other, though independent, let test samples into feature selection. In the one task where foundation models were tested independently and cleanly against the standard tool on the same patient data, the standard tool won.
The models still have uses. This guide shows which tasks they fit, which model to pick for each, and what each one costs to run.
The Decision Tree: What Are You Actually Trying to Do?
Start with the clinical task, not the model. The eight tasks below cover most of what a molecular pathology lab does with DNA and RNA sequencing. I added a ninth row for variant effect scoring, which is where foundation models do best.

Which model, if any, for each diagnostic task. Diagram by the author, from the evidence reviews linked below.
| Area | Task | Established method | Foundation model evidence |
|---|---|---|---|
| Oncology | Tumour somatic SNVs and indels | Mutect2 | None found |
| Oncology | Tumour RNA fusions | STAR-Fusion, Arriba | None found |
| Oncology | ctDNA fragmentomics | ichorCNA, DELFI fragment features | Fragmentia-AI, developers' test only |
| Oncology | ctDNA methylation | Elastic net (detection); MethAtlas, CelFiE (tissue of origin) | CpGPT, one small test with leakage |
| Inherited disorders | Splice variants confirmed in patient RNA | SpliceAI or Pangolin, then FRASER on RNA-seq | Independent test: SpliceAI beat all five models tested |
| Oncology and inherited | Copy-number variants | ExomeDepth, CNVnator (calling); AnnotSV, ClassifyCNV (classification) | None found |
| Infectious disease | DNA pathogen identification | minimap2 (as in BugSeq), or MEGAN-LR with protein alignment | None found |
| Infectious disease | RNA pathogen detection | Alignment to NCBI nt, as in SURPI+ and CZ ID | None found |
| Oncology and inherited | Variant effect scoring, after calling | CADD, AlphaMissense, GPN-MSA | Evo 2 embeddings competitive on ClinVar |
This table asks whether a foundation model has been evaluated at all. A wider question gives different answers: does any machine-learning method beat the best pre-ML method on the same data? For somatic calling, deep-learning callers drew level with Mutect2 in independent tests, but no foundation model has been compared.
If you do want to use a foundation model
Variant effect scoring is the place to try one. Evo 2 7B fits on a single 48 GB GPU at 8 kb. It scored our BRCA1 test set for $0.45 to $0.80 per 1,000 variants; patient variants, which need two windows each, would cost about $0.67 to $1.19. For coding variants, keep AlphaMissense or CADD alongside it.
Building your own classifier on DNA sequence:
- Up to a few kb: DNABERT-2 or Nucleotide Transformer v2, with frozen embeddings and mean pooling.
- Longer inputs: a HyenaDNA checkpoint pretrained on 2 to 4 times your longest input, Caduceus, or NTv3.
- Over 100 kb: NTv3 or Evo 2. Check memory first: Evo 2 7B ran out of memory at 131 kb on an 80 GB H100 in our runs.
Whatever you pick, compare it with a non-foundation-model baseline on the same split of your own data.
Use Case by Use Case
Each task has a full evidence review with every number and source. Here is what each one means for model choice.
Tumour somatic SNVs and indels. I found no foundation model evaluated. Among deep-learning callers, DeepSomatic matched Mutect2 and beat Strelka2 in the one independent tumour-normal test, a single-author preprint, and NeuSomatic beat Mutect2 in 3 of 8 comparisons. Start with Mutect2 and test a deep-learning caller against it. DRAGEN, a licensed Illumina product that runs a Bayesian caller on accelerated hardware, is the main commercial alternative to these open tools. Full review.
Tumour RNA fusions. No foundation model or deep-learning caller has been compared with STAR-Fusion or Arriba. Full review.
Splice variants confirmed in patient RNA. This is the one clean independent same-data test. Alavi (2026, preprint, not a developer of any of the models) tuned thresholds on OPA1 variants, then scored 76 canonical splice-site variants confirmed in patient RNA and 107 benign variants, across 65 genes in all, with the benign variants in 46 of them (preprint). Sensitivity is the share of true splice variants flagged; specificity is the share of benign variants correctly left alone.
| Model | Sensitivity | Specificity |
|---|---|---|
| SpliceAI | 88.2% | 99.1% |
| NTv3 650M | 85.5% | 86.9% |
| Evo 2 40B | 71.1% | 100% |
| Borzoi | 73.7% | 96.3% |
| AlphaGenome | 56.6% | 80.4% |
| Genos 10B | 27.6% | 85.0% |
SpliceAI won. Canonical splice sites are the easiest class, so the gap may be wider for deep intronic variants. The day before Alavi's preprint appeared, Illumina released SpliceAI2 (press release, 8 October 2026). It beat SpliceAI, Pangolin and AlphaGenome on GTEx cryptic splice variants, with area under the precision-recall curve (higher is better; suited to rare positives) of 0.77 against 0.66, 0.56 and 0.54. It also recovered 133 excess panel-matched variants in the Genomics England rare-disease cohort against 114 for the next best model (SpliceAI2 preprint). These are Illumina's own results, so wait for an independent test. I am adding it to the benchmark database (rewire-benchmark-data#127) and will update this paragraph when that lands. For now, use SpliceAI or Pangolin to prioritise variants and confirm in RNA. Full review.
ctDNA fragmentomics. Fragmentia-AI, a fragment model built on DNABERT-2, reached AUC 0.956 against 0.935 for DELFI features in its developers' study. It has not been compared with ichorCNA, the standard tumour-fraction method. Promising, not proven. Full review.
ctDNA methylation. CpGPT, a model pretrained on methylation arrays and fine-tuned by researchers who did not develop it, scored AUROC 0.990 against 0.942 for elastic net and 0.957 for an SVM. That is a mean over three test sets of about 30 samples each, from a cohort of 300, and the CpG sites were selected using the test samples. The gap is likely overstated. Full review.
Copy-number variants. I found no foundation model evaluated for calling or classification. The established callers have weak results on exome data, so read the review before choosing. Full review.
DNA pathogen identification. I found no foundation model evaluated. Neural-network classifiers such as BERTax and MetageNN have been tested only by their developers on simulated or mock data. MetageNN found more reads from species missing from the database than MEGAN-LR, but with lower precision. Start with minimap2 (as in BugSeq) or MEGAN-LR with protein alignment, and avoid default Kraken2 databases. Full review.
RNA pathogen detection. I found no foundation model evaluated. The established approach aligns non-human reads to the NCBI nucleotide database, as SURPI+ and CZ ID do. Full review.
Variant effect scoring. Once a variant is called, scoring how damaging it is is where DNA language models do best. In the EVEE preprint, a probe (a simple classifier trained on a model's embeddings) on Evo 2 7B reached AUROC 0.971 on deconfounded ClinVar SNVs, with AlphaMissense at 0.972 on missense variants alone (first version). In the latest version, the probe reached 0.991 on ClinVar indels against 0.980 for CADD (Pearce et al. 2026). Several of the authors are Evo 2 co-authors, so this is not an independent test. Evo 2 does not lead everywhere: in its own paper it trails ESM-1b and GPN-MSA on coding SNVs, and in TraitGym (Benegas et al. 2025), a benchmark of non-coding variants built by the developers of GPN-MSA, alignment-based models such as CADD and GPN-MSA compare favourably. It is also expensive at scale: EVEE's embedding extraction took about 20,000 H100-hours.
The DNA Models in 2026
They range from under a million to 40 billion parameters, and from a few kb to 1 Mb of input. Pick by the job.
| Model | Sizes | Longest input | Best for | Get it |
|---|---|---|---|---|
| DNABERT-2 | 117M | A few kb in practice | Short-sequence classification on modest GPUs | GitHub, Hugging Face |
| Nucleotide Transformer v2 | 50M to 500M | 12 kb | Short-sequence classification, cross-species work | GitHub |
| NTv3 | 8M to 650M | 1 Mb | Long inputs on one GPU | GitHub, Hugging Face |
| HyenaDNA | 0.44M to 6.6M | 1M bases | Very long inputs at low cost | GitHub, Hugging Face |
| Caduceus | About 2M to 7M | 131 kb | Human genome classification | GitHub |
| Evo 2 | 7B, 20B, 40B | 1 Mb | Variant effect scoring, generation | GitHub |
| AlphaGenome | n/a | 1 Mb | Predicting functional readouts of a variant | API, weights |
DNABERT-2 is the small, fast default for short sequences. It "achieves comparable performance to the state-of-the-art model with 21x fewer parameters and approximately 92x less GPU time in pre-training", where the comparator is the 2.5-billion-parameter Nucleotide Transformer (Zhou et al., ICLR 2024). It has 117M parameters. Its tokenizer groups common runs of bases into single tokens, which cuts sequence length about fivefold, and the authors say this enables "efficient fine-tuning on most consumer GPUs". It has no hard length limit, but it has a recommended length limit of about 2 kb, as Feng and colleagues note (Feng et al., Nature Communications 2025).
Nucleotide Transformer comes in two generations that matter. The original family runs up to 2.5B parameters, trained on 3,202 human genomes and 850 genomes from other species (Dalla-Torre et al., Nature Methods 2025). Bigger was not better: the 250M-parameter NT-v2 "attained the best performance on our benchmark (average MCC of 0.769) while being ten-times smaller than the 2.5B-parameter model". MCC, the Matthews correlation coefficient, is a balanced accuracy score from -1 to 1. The NT-v2 models run from 50M to 500M parameters with a 12 kb context. NTv3, posted in December 2025 in sizes from 8M to 650M, is designed to run inference on full megabase windows on a single A100 or H100, according to its authors (NTv3 preprint).
HyenaDNA was built for length. It handles "context lengths of up to 1 million tokens at the single nucleotide-level", "an up to 500x increase over previous dense attention-based models" (Nguyen et al., NeurIPS 2023). At one million tokens it trains 160 times faster than a Transformer. Not 1.6 times. One hundred and sixty. The reason is algorithmic: the cost of a Hyena layer grows only slightly faster than the sequence length, while the cost of dense attention grows with its square. Double the input and attention does four times the work. The models themselves are tiny, from 0.44M to 6.6M parameters.
A caveat on HyenaDNA. The speed is real; the accuracy on short sequences is not. In independent benchmarks, attention models beat HyenaDNA on short-range tasks, and HyenaDNA does better only with longer context (GenBench, Liu et al. 2024). On a 16S microbiome cancer-detection benchmark, it trailed the best classical methods on held-out data (BreCol, Dick 2026). If you do need length, pick the checkpoint carefully: the HyenaDNA authors found that a pretrained length of 2 to 4 times your longest input works best (Nguyen et al., Appendix A.1).
Caduceus reads both DNA strands, and its cost grows in step with sequence length. The released models have about 2M to 7M parameters and were pretrained on 131 kb sequences (Schiff et al., ICML 2024). In Feng and colleagues' benchmark, its Caduceus-Ph variant was the strongest model across human genome classification tasks.
Evo and Evo 2 are the large generative models. Evo has 7B parameters and a 131 kb context, trained on 300B tokens from over 80,000 bacterial and archaeal genomes plus phage and plasmid sequences. That is 1,000 times HyenaDNA's size and 100 times its data, and it can generate megabase-scale sequences (Nguyen et al., Science 2024). Because it was trained only on prokaryotic and phage genomes, its authors note its limits on human proteins. Evo 2 was trained to address that, on a dataset of more than 8.8 trillion nucleotides from all domains of life (Brixi et al., Nature 2026). The paper describes 7B and 40B models with contexts up to 1 Mb; the 40B was trained on 9.3 trillion tokens and is the strongest in the paper. Arc added a 20B model in February 2026 (release v0.5.0). A 1B model exists with an 8 kb context, but the Evo 2 paper says it "should be avoided owing to overall weaker performance".
AlphaGenome is not a language model. It is trained on measured data to predict thousands of functional readouts from 1 Mb of sequence: expression, splicing, chromatin state and contacts (Avsec et al., Nature 2026). Its distilled model, a single network with the same architecture in place of an ensemble, scores a variant in under a second on an H100. The free API and the downloadable weights are for non-commercial use; commercial use is available through Google Cloud. Its terms also say predictions must not be used for clinical decision-making (AlphaGenome README), which rules it out of a diagnostic report today.
Others you will see. GENA-LM (GitHub) takes inputs of about 4.5 kb or 36 kb (Fishman et al., NAR 2025). Genos (1.2B and 10B, inputs up to 1 Mb) appears in the splicing comparison above (Lin et al., GigaScience 2025). GenomeOcean (100M to 4B, Yu et al. 2026) has published memory figures, below. Of the three, only Genos has had an independent clinical test, the splicing comparison above.
All of these have open weights or open access, but licences differ by checkpoint. Check before you build a clinical service on one.
Independent Benchmarks
Two benchmarks are worth reading before any developer's own table. They test what a model's embeddings capture, using research tasks, not diagnostic workflows. The use-case section above covers that gap.
Feng and colleagues (Peng Wei and Chong Wu's groups at MD Anderson, Nature Communications 2025) compared DNABERT-2, Nucleotide Transformer v2, HyenaDNA, Caduceus and GROVER with frozen embeddings and the same classifier on top. They found no clear quadratic runtime growth for attention models on a single A100 at batch size 1, so do not assume a fixed length at which attention becomes unusable. Measure it on your inputs.
GenBench (Liu et al. 2024) covers ten models across 43 datasets. It shows the architecture trade-off most clearly: attention models are stronger on short-range tasks, and HyenaDNA does better with longer context.
The Pooling Strategy
A model produces one vector per token, and pooling turns those into one vector per sequence. Mean pooling averages them; the CLS token uses a single summary token. Feng and colleagues' most useful finding: "Mean token embedding consistently and significantly improves sequence classification performance, outperforming other pooling strategies." If you use the CLS token or max pooling, switch to mean pooling: it was significantly better in 35 to 42 of 52 datasets, depending on the model. It is one line of code, and the example at the end of this guide uses it. The finding covers DNA sequence classification with frozen embeddings; check it on your own task if you fine-tune.
Hardware Requirements: What You Actually Need
Compute drives most practical decisions, so here is what has been measured. Every figure below is our own measurement, a published figure with its source, or our calculation from published figures, labelled as such.
Evo 2 7B: measured
We ran Evo 2 7B on the same job on three cloud GPU offers: scoring 3,893 BRCA1 SNVs (a saturation genome editing set) in 8,192 bp windows, one window at a time, with default settings (16-bit precision with 8-bit input projections), at October 2026 list prices (full write-up).
| GPU | Price tier | Price per hour | Windows per second | Per 1,000 variants, this test set | Per 1,000 patient variants |
|---|---|---|---|---|---|
| H100 80 GB, Google Cloud | Spot | $6.29 | 2.93 | $0.80 | $1.19 |
| H100 80 GB, Runpod | On demand | $4.02 | 2.91 | $0.51 | $0.77 |
| L40S 48 GB, Runpod | On demand | $1.12 | 0.61 to 0.93 | $0.45 to $0.68 | $0.67 to $1.01 |
The price tiers differ, so the rows are not like for like: the Google Cloud price is Spot, which can be reclaimed mid-run, and Runpod is on demand. The test set needs 5,219 windows for 3,893 variants because neighbouring variants share reference windows; a patient's variants sit at different positions, so each needs two windows. The L40S range covers two hosts: 0.61 windows per second in the recorded run and 0.93 on a faster host in an earlier run, recorded in the study's run log.
Peak memory was 16.8 GiB on all three. It grew to 30.4 GiB at 33 kb, and the model ran out of memory at 131 kb on both the H100 and the L40S. So with Arc's standard inference code, Evo 2 7B's 1 Mb context does not fit on one GPU. The hourly price misleads: the L40S costs a quarter of the H100 per hour but ran three to five times slower, so per variant it came out cheapest on the faster host and second most expensive on the slower one. Running in full 32-bit precision made the H100 5.8 times slower.
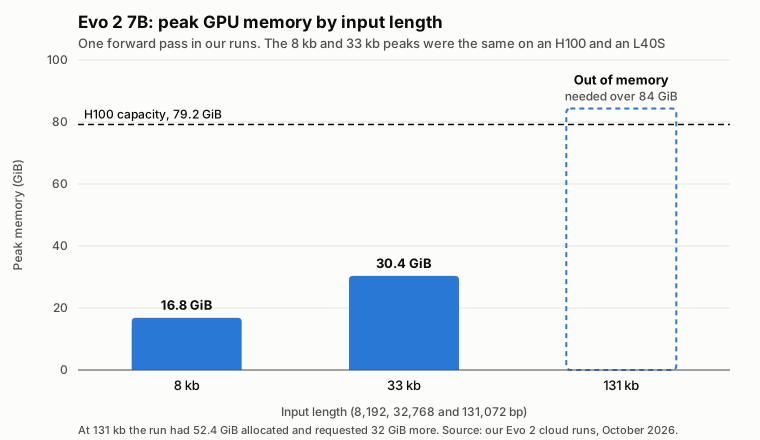
Evo 2 7B peak memory against input length, measured in our runs.
A reality check on scale. The whole Runpod H100 run, which scored all 3,893 BRCA1 variants plus test workloads, cost $2.82 including model downloads; the scoring itself was about $2.00. That is cheap for one gene. Embeddings for every ClinVar variant are another matter: EVEE's 20,000 H100-hours would cost about $80,000 at the Runpod rate above. Every variant in one genome, 4.1 to 5.0 million, would cost about $3,100 to $3,800 at the Runpod H100 patient-variant rate. Budget for the variants you need, not the whole database or genome.
The larger sizes need more. Arc reports the 20B model on one H100 at 46 GB peak for an 8 kb sequence, and the 40B on two H100s at 95 GB, at 0.7 and 1.5 seconds per sequence (release v0.5.0). The 1B, 20B and 40B models need 8-bit (FP8) arithmetic through Nvidia's Transformer Engine and a Hopper-generation GPU such as the H100. The 7B runs in 16-bit precision on any supported GPU (Evo 2 README).
Does the GPU change the answer?
For a validated pipeline, this matters more than cost. Same image, code and inputs, on each GPU (study repository):
- Same GPU product, different clouds: two H100s, on Google Cloud and Runpod, gave bit-identical scores for all 3,893 variants. Repeat runs on the same product changed no calls.
- Different GPU product: with a loss-of-function threshold set on the H100 scores and applied unchanged to the L40S, 72 of 3,893 variants (1.8%) changed call at the Youden threshold, and 152 (3.9%) and 189 (4.9%) at thresholds set for 90% and 95% sensitivity. The flips ran in both directions, and most variants that flipped sat close to the threshold (classification flips).
- Precision matters as much as hardware: on one GPU, changing the precision moved scores by about as much as changing the GPU did. In full 32-bit precision (FP32) the H100 and L40S agreed to a median of 4.8e-7, and 0, 0 and 1 of 487 variants changed call at the three thresholds, against 8, 13 and 22 in the default configuration (follow-up results).
- Same architecture is not enough: an L40 and an L40S, both Ada GPUs, disagreed as much as an H100 and an L40S.
The L40S passed Arc's correctness test, which was not designed to catch this. So validate a threshold on the GPU product you will run, or compute in FP32 at three to six times the GPU time. Report a margin around the threshold, because variants near it can change call with hardware alone.
Other models: what the authors report
| Model | What the authors report |
|---|---|
| DNABERT-2 | Fine-tunes "on most consumer GPUs" (Zhou et al.) |
| Nucleotide Transformer 2.5B | Weights take 9.5 GB; fine-tuning took 50 minutes on eight A100s (Dalla-Torre et al., Methods) |
| NTv3 | Inference on 1 Mb windows on one A100 or H100; the 8M model runs tens of kb on a laptop CPU (NTv3 preprint) |
| HyenaDNA 32k | Model card suggests a T4 (16 GB) to fine-tune and run (model card) |
| HyenaDNA 1M | Model card suggests an A100 80 GB to fine-tune and an A100 40 GB to run (model card) |
| Caduceus | Experiments ran on GPUs from an RTX 3090 to an A100 (Schiff et al., Appendix F) |
| AlphaGenome | Under 1 second per variant on an H100 (Avsec et al.); the repository recommends at least an H100 (README) |
| GenomeOcean | Peak 21 GB (100M), 47 GB (500M) and 72 GB (4B) on an H100 when extracting embeddings, with 5 kb inputs for the two smaller models and 50 kb for 4B; batch size not stated (Yu et al. 2026) |
We are measuring memory, throughput and cost for these models on the same BRCA1 job and will add the results here. For calling itself, published benchmarks show GPU pipelines (NVIDIA Parabricks) and DRAGEN servers cutting a whole-genome germline run from 17 to 39 hours on CPUs to between half an hour and about two hours, with close agreement to the CPU calls in the one study that compared them. Details, and open CPU alternatives, are in the execution review.
Training time expectations
You will rarely pretrain from scratch, but the numbers show why small models are cheap to adapt and large ones are not. The table multiplies the hardware and time each team reported by today's cloud price.
| Model | What the authors report | GPU-hours | At today's price |
|---|---|---|---|
| Nucleotide Transformer 2.5B | 128 A100s for 28 days | 86,016 | about $154,000 |
| NTv3 650M | Pretraining and later stages on H100s | 8,920 | about $35,600 |
| HyenaDNA, 1M context | Up to 8 A100s for 4 weeks | up to 5,376 | up to about $9,600 |
| DNABERT-2 | 8 RTX 2080 Ti for about 14 days | 2,688 | about $1,300 |
| HyenaDNA, small | One A100 for 80 minutes | 1.3 | about $2 |
Our calculation, not what the authors paid: reported GPU-hours multiplied by Runpod's on-demand prices on 13 October 2026 (A100 80 GB $1.79 per hour, H100 $3.99). The RTX 2080 Ti is no longer offered, so DNABERT-2 is priced at an RTX 3090 ($0.50), a faster successor. The small HyenaDNA model used an A100 40 GB, priced here at the 80 GB rate. Storage, networking, failed runs and staff time are excluded. Sources: Nucleotide Transformer Methods; NTv3 Table 5; HyenaDNA Section 5, Appendix A.1 and Table A.2; DNABERT-2 Appendix A.3. The HyenaDNA paper's own tally for Nucleotide Transformer 2.5B is higher, at 215,000 GPU-hours; the table uses the Nucleotide Transformer paper's figures.
A hundredfold difference in pretraining cost does not mean a hundredfold difference in usefulness. DNABERT-2 matched the 2.5B Nucleotide Transformer on its authors' benchmark, and the 250M NT-v2 beat the 2.5B model on the Nucleotide Transformer benchmark.
Fine-tuning is far cheaper. The Nucleotide Transformer authors fine-tuned in 20 minutes for the 500M model and 50 minutes for the 2.5B model on one node of eight A100s. An independent study fine-tuned NT 500M on about 89,000 eQTL variants in about 7.5 hours per five-epoch run (Hegde et al., Genes 2025).
Frozen Embeddings or Fine-tuning
Start with frozen embeddings
Extract embeddings, mean-pool them, and train a simple classifier on top. This is a probe, not zero-shot prediction: the classifier still learns from your labels. Nucleotide Transformer probes matched a supervised baseline (BPNet) on 5 of 18 tasks and beat it on 8. Always compare against a non-foundation-model baseline on the same split.
Fine-tune
When the probe leaves a gap, and you have enough labelled examples to keep a validation set separate from your test set. Fine-tuned Nucleotide Transformer models matched 6 of 18 supervised baselines and beat the other 12. Within that first generation, larger and more diverse models did better; the later 250M NT-v2 then matched them at a tenth of the size.
Parameter-efficient fine-tuning
You do not need to update every weight. (IA)3 and LoRA add a small number of trainable weights to a frozen model. Nucleotide Transformer uses (IA)3, which trains about 0.1% of the parameters, and DNABERT-2's training script has a LoRA option. Either way, fine-tuning needs far less GPU memory than updating every weight.
What These Models Can't Do (Yet)
They are not yet part of validated diagnostic workflows. I found no published study that evaluates a genomic foundation model inside an end-to-end clinical pipeline. Our own runs measured one part of that, reproducibility across GPUs, and found calls that change with the GPU product unless the threshold is validated on it.
Context limits persist in practice. A 1M-token window is about 0.03% of a 3.2-billion-base genome, and in our runs Evo 2 7B on one GPU could not reach 131 kb. Chromosome-scale questions are still out of reach.
Predictions are not explanations. These models learn useful representations, but turning a score into a mechanism a clinical scientist can report is still hard.
Training data shapes what they know. Evo was trained only on prokaryotic and phage genomes (Nguyen et al. 2024). Check what a checkpoint was trained on before you test it on your organism.
Developer benchmarks flatter. Most of the strongest numbers in this guide come from the people who built the model. The one clean independent same-data clinical test so far went to the established tool.
Getting Started: Extracting DNA Embeddings
This example embeds three short synthetic sequences with DNABERT-2, mean-pools them, and compares them. It runs on a laptop CPU. The first run downloads about 470 MB of weights.
DNABERT-2 loads its own model code from Hugging Face (trust_remote_code=True), so the script pins an exact revision. Install the tested versions in a fresh Python 3.11 environment (the pinned versions have no prebuilt packages for Python 3.12 or later):
pip install torch==2.4.1 transformers==4.29.2 einops==0.8.2 numpy==2.4.6
import time

import torch
from transformers import AutoModel, AutoTokenizer

MODEL = "zhihan1996/DNABERT-2-117M"
REVISION = "7bce263b15377fc15361f52cfab88f8b586abda0"  # pin the model code and weights

sequences = {
    "tata_promoter": "TATAAAAGGCGCGCCGCCATGGCGCGCTATAAAAGGCTTGACCGGTCAATGCATCG",
    "cpg_island": "CGCGGCGCGCCGCGCGGGCGCGCCGCGCGCGGCCGCGCGCGGCGCGCCGCGCGCGG",
    "at_rich": "ATATTTAAATATTTTAAATTATATTTAAATTTATAAATATTTAAATATTTAAATAT",
}

tokenizer = AutoTokenizer.from_pretrained(MODEL, revision=REVISION, trust_remote_code=True)
model = AutoModel.from_pretrained(MODEL, revision=REVISION, trust_remote_code=True)
model.eval()

embeddings = {}
start = time.perf_counter()
with torch.no_grad():
    for name, seq in sequences.items():
        inputs = tokenizer(seq, return_tensors="pt")["input_ids"]
        hidden = model(inputs)[0]            # shape: [1, tokens, 768]
        embeddings[name] = hidden[0].mean(dim=0)  # mean pooling over tokens
        print(f"{name}: {len(seq)} bp -> {inputs.shape[1]} tokens -> embedding {tuple(embeddings[name].shape)}")
print(f"CPU time for {len(sequences)} sequences: {time.perf_counter() - start:.2f} s")

names = list(embeddings)
stacked = torch.nn.functional.normalize(torch.stack([embeddings[n] for n in names]), dim=1)
similarity = stacked @ stacked.T
print("\nCosine similarity")
print(" " * 14 + "".join(f"{n:>15}" for n in names))
for i, n in enumerate(names):
    print(f"{n:<14}" + "".join(f"{similarity[i, j].item():>15.3f}" for j in range(len(names))))
Output on an Apple M4 laptop (timing varies; the first run is slower):
tata_promoter: 56 bp -> 15 tokens -> embedding (768,)
cpg_island: 56 bp -> 15 tokens -> embedding (768,)
at_rich: 56 bp -> 11 tokens -> embedding (768,)
CPU time for 3 sequences: 0.17 s

Cosine similarity
                tata_promoter     cpg_island        at_rich
tata_promoter           1.000          0.611          0.446
cpg_island              0.611          1.000         -0.016
at_rich                 0.446         -0.016          1.000
The tokenizer turns 56 bases into 11 to 15 tokens, and each sequence becomes one 768-number vector. The GC-rich and AT-rich sequences come out unrelated, while the mixed sequence sits between them. The loader also warns that the pooler layer is newly initialised; that does not matter here, because the script pools the token embeddings itself. From here, train a classifier on these vectors and compare it with a simple baseline on the same split.
For Evo 2 on a cloud GPU, including container, disk and cost, follow the step-by-step guide.
Conclusion
For a diagnostic lab in 2026, the answer to "which genomic foundation model should I use?" is: the established tool for calling and detection, and a foundation model as a candidate to test against it.
- Calling, fusions, CNVs and pathogens: keep your current tools. I found no foundation model tested against them.
- Splice variants: SpliceAI or Pangolin, then confirm in RNA.
- Variant effect scoring: this is where to try one. Evo 2 7B alongside CADD or AlphaMissense, on a 48 GB GPU, for about $0.45 to $1.19 per 1,000 variants. Validate any threshold on the GPU product you run.
- Your own sequence classifier, up to a few kb: DNABERT-2 or NT-v2, frozen and mean-pooled, against a non-foundation-model baseline on the same split.
References
- Zhou Z, et al. DNABERT-2: Efficient Foundation Model and Benchmark For Multi-Species Genome. ICLR 2024. arXiv:2306.15006
- Dalla-Torre H, et al. Nucleotide Transformer: building and evaluating robust foundation models for human genomics. Nature Methods 22, 287 to 297 (2025). doi:10.1038/s41592-024-02523-z
- Boshar S, et al. A foundational model for joint sequence-function multi-species modeling at scale for long-range genomic prediction. bioRxiv (2025). Introduces NTv3. doi:10.64898/2025.12.22.695963
- Nguyen E, et al. HyenaDNA: Long-Range Genomic Sequence Modeling at Single Nucleotide Resolution. NeurIPS 2023. arXiv:2306.15794
- Schiff Y, et al. Caduceus: Bi-Directional Equivariant Long-Range DNA Sequence Modeling. ICML 2024. arXiv:2403.03234
- Nguyen E, et al. Sequence modeling and design from molecular to genome scale with Evo. Science 386, eado9336 (2024). doi:10.1126/science.ado9336
- Brixi G, et al. Genome modelling and design across all domains of life with Evo 2. Nature 652, 1349 to 1361 (2026). doi:10.1038/s41586-026-10176-5
- Arc Institute. Evo 2 release v0.5.0: 20B model and hardware notes. GitHub (2026). ArcInstitute/evo2
- Avsec Ž, et al. Advancing regulatory variant effect prediction with AlphaGenome. Nature 649, 1206 to 1218 (2026). doi:10.1038/s41586-025-10014-0
- Fishman V, et al. GENA-LM: a family of open-source foundational DNA language models for long sequences. Nucleic Acids Research 53, gkae1310 (2025). doi:10.1093/nar/gkae1310
- Lin A, et al. Genos: a human-centric genomic foundation model. GigaScience 14, giaf132 (2025). doi:10.1093/gigascience/giaf132
- Yu M, et al. FP8 Inference in Genomic Foundation Models: Theoretical vs. Realized Speedups on GenomeOcean. bioRxiv (2026). doi:10.64898/2026.08.09.743676
- Feng H, et al. Benchmarking DNA foundation models for genomic and genetic tasks. Nature Communications 16, 10780 (2025). doi:10.1038/s41467-025-65823-8
- Liu Z, et al. GenBench: A Benchmarking Suite for Systematic Evaluation of Genomic Foundation Models. arXiv (2024). arXiv:2406.01627
- Benegas G, et al. Benchmarking DNA Sequence Models for Causal Regulatory Variant Prediction in Human Genetics. bioRxiv (2025). Introduces TraitGym. doi:10.1101/2025.02.11.637758
- Dick JM. BreCol: Benchmarking Classical and Deep-Learning Methods for Microbiome-Based Cancer Detection. arXiv (2026). arXiv:2609.27207
- Alavi MV. Probing Genomic Foundation Models with Splice-Variant Perturbations. bioRxiv (2026). doi:10.64898/2026.10.02.756289
- Jaganathan K, et al. A unified framework for quantitative splicing and transcript prediction. Illumina preprint (2026). Introduces SpliceAI2. PDF; press release, 8 October 2026
- Pearce MT, et al. Interpretable variant effect prediction from genomic foundation model embeddings. bioRxiv (2026). Introduces EVEE; versions 1 to 3 are titled "EVEE: ...". Version 1; latest, doi:10.64898/2026.04.10.717844
- Hegde M, et al. Reaping the Fruits of LLM Pruning: Towards Small Language Models for Efficient Non-Coding Variant Effect Prediction. Genes 16, 1358 (2025). doi:10.3390/genes16111358
Help improve this article
Found an error or a better source? Leave a note here, or highlight a passage to comment on it.