SpliceAI and Pangolin are the most accurate DNA-based splice predictors on variants tested in patient RNA, and SpliceAI beat motif-scoring methods on every labelled set where both were run. Even so, no predictor replaces the RNA test. Aberrant-splicing callers run on patient RNA-seq recover anywhere from none to most of the known pathogenic events, and most report outliers in every negative sample. No machine-learning caller has been compared with the count-based baseline for that step.
Evidence tables: every comparison in this review, with per-tool values and source details, is on the Inherited-disorder patient-RNA splicing validation use case in the Rewire benchmark database.
The practical question is which DNA and RNA evidence identifies a splice-altering variant in a patient with a suspected inherited disorder, when RNA from blood, cultured fibroblasts or muscle is available. A diagnostic lab answers it in two steps. It first decides which variants are likely to change splicing, then tests them in RNA, either by targeted RT-PCR or by transcriptome-wide RNA-seq. This review covers seven published comparisons. Three score DNA-based predictors and four score RNA-seq callers. I did not rerun any tool. Values from different studies cannot be pooled, because each has its own truth set, tissue and scoring rule.
Two tasks, two kinds of tool
The two steps use different software. In-silico splice prediction works from DNA sequence alone and asks whether a variant will change splicing. Aberrant-splicing detection works from RNA-seq reads and asks whether a sample shows splicing that other samples do not. The tools answer different questions and fail in different ways, so I treat them as separate families with separate baselines.
Prediction from DNA and detection in RNA, and where each family sits. Diagram by the author.
Motif scoring of splice sites. These methods score the short sequence around a donor or acceptor site and report how much a variant changes that score. MaxEntScan fits a maximum-entropy model to known splice-site motifs (Yeo and Burge 2004). GeneSplicer uses Markov models, and SpliceSiteFinder-style tools use a position weight matrix. NNSplice, a shallow neural network with one hidden layer, is usually grouped with them (Fortier et al. 2026). These scores see a few dozen bases. They cannot model distant regulatory sequence and are weak on deep intronic variants that create pseudoexons.
Deep sequence models. SpliceAI is a deep residual convolutional network that reads 10,000 bases around each position and predicts whether it is a donor, an acceptor or neither (Jaganathan et al. 2019). Comparing predictions for the reference and variant sequence gives four delta scores: acceptor gain and loss, donor gain and loss. Pangolin uses a similar design trained on splice-site usage across tissues and species (Zeng and Li 2022). SpliceAI's weights and precomputed scores are licensed for non-commercial use only. OpenSpliceAI and CI-SpliceAI are open-source reimplementations retrained on different annotations.
Feature-based predictors. SPiP is a machine-learning pipeline that combines several splicing scores and sequence features (Leman et al. 2022). SQUIRLS uses a small set of interpretable features with a trained classifier (Danis et al. 2021).
Tissue-aware predictors. MMSplice scores exon and intron modules separately (Cheng et al. 2019). AbSplice adds tissue-specific splice-site usage to predict aberrant splicing in a named tissue (Wagner et al. 2023). Neither appears in a tabled comparison against RNA-validated variants among the studies reviewed here.
Genomic foundation models. Models such as Nucleotide Transformer v3 (NTv3), Evo 2 and Genos are trained to predict DNA sequence itself. A variant can be scored zero-shot as the change in the model's log-likelihood. AlphaGenome and Borzoi are different: they are trained to predict functional genomics tracks, including RNA-seq coverage and, for AlphaGenome, splice junctions. None of these was built for clinical splice prediction.
Count-based outlier callers. FRASER counts split reads at each splice site in each sample and computes the fraction of reads using each donor or acceptor. It then fits a beta-binomial model with a denoising autoencoder that removes shared variation across the cohort and reports introns whose usage in one sample is far from the expected value (Mertes et al. 2021). FRASER 2.0 replaces the separate splicing metrics with one intron Jaccard index (Scheller et al. 2023). LeafCutterMD models intron clusters with a Dirichlet-multinomial distribution (Jenkinson et al. 2020). OUTRIDER applies the same outlier logic to gene expression (Brechtmann et al. 2018), and the DROP pipeline runs FRASER and OUTRIDER together (Yépez et al. 2021). All of these need a cohort of samples from the same tissue.
Other RNA-seq approaches. rMATS-turbo tests differential splicing between groups and is used here with one patient against controls (Wang et al. 2024). MINTIE assembles reads into contigs and reports novel splice and structural variants absent from controls (Cmero et al. 2021). saseR fits standard count models with offsets to speed up aberrant splicing and expression retrieval (Segers et al. 2026).
The baseline
Because the two tasks differ, each has its own baseline. For prediction it is motif scoring of splice sites, as in MaxEntScan, GeneSplicer and position weight matrices. These were the standard before deep learning. The one same-data version tested also includes NNSplice, a shallow neural network, so it is a pre-deep-learning baseline rather than one free of machine learning. They also shape current truth sets: in the largest RNA-tested cohort below, most variants were sent for testing because Alamut Visual Plus, which reports this kind of score, predicted a splicing change. For detection the baseline is count-based statistical outlier modelling, as in FRASER. FRASER appears in all four detection studies, is packaged in DROP, and none of its competitors in these studies is a machine-learning caller.
For the lab's decision, the detection baseline matters more. The best DNA predictor still misclassified about a quarter of the variants without a splicing effect in Drost et al., so a predictor can rank variants for testing but cannot replace the RNA result.
The baseline is not the truth. Truth here comes from targeted RT-PCR and Sanger sequencing of patient RNA, exon trapping, minigene assays, or events found and confirmed in earlier diagnoses. A newer method beats the baseline only if it scores better against the same truth on the same data.
| Method | Family | Baseline | Result against the baseline in the same study | Study |
|---|---|---|---|---|
| Legacy Ensemble (MaxEntScan, NNSplice, GeneSplicer, matrix vote) | Motif scoring | Yes (prediction) | Balanced accuracy 0.785, 0.659, 0.752 and 0.785 on four labelled sets | Fortier et al. (authors' employer supplies the ensemble) |
| SpliceAI | Deep sequence model | No | Better on all four sets: 0.898, 0.836, 0.803 and 0.940 | Fortier et al. (independent) |
| CI-SpliceAI | Deep sequence model | No | Better on all four: 0.907, 0.794, 0.798 and 0.890 | Fortier et al. (independent) |
| OpenSpliceAI | Deep sequence model | No | Better on all four: 0.895, 0.746, 0.797 and 0.841 | Fortier et al. (independent) |
| Pangolin, SPiP, SQUIRLS | Deep or feature-based | No | Never compared with motif scoring on the same data | None |
| NTv3, Evo 2, Genos, AlphaGenome, Borzoi | Foundation or sequence-to-function models | No | Compared with SpliceAI only, not with motif scoring; all below SpliceAI | Alavi (independent, preprint) |
| FRASER | Count-based outlier model | Yes (detection) | 13 of 16 known muscle events at |dPSI| > 0.1; 21 of 68 across three tissue sets | Segarra-Casas et al.; Silverstein et al. (independent) |
| FRASER 2.0, LeafCutterMD, saseR, rMATS-turbo, MINTIE | Statistical or assembly | No | Statistical alternatives, not machine learning; results in the sections below | Several |
| Machine-learning or foundation-model RNA-seq caller | Not applicable | No | None appears in any comparison reviewed here | None |
Balanced accuracy is from Fortier et al. 2026, Tables 1 to 4, in the order CI-SpliceAI variant set, Riepe functional assays, SPiP set and Barbosa deep intronic set.
So for prediction, deep learning beats the motif-scoring baseline wherever both were run. For detection, no machine-learning method has been tested against the baseline at all.
| Family (tools) | Accuracy | Reproducibility | Compute | Ease of use | Interpretability |
|---|---|---|---|---|---|
| Motif scoring (MaxEntScan, GeneSplicer, matrices), prediction baseline | Lowest balanced accuracy on all four Fortier sets | Fixed matrices; deterministic scores | Negligible, CPU | Bundled in annotation software | Score change at a named site |
| Deep sequence models (SpliceAI, Pangolin, reimplementations) | Highest AUROC on RNA-tested variants (Drost) | Depends on annotation, distance and masking settings | CPU per variant; precomputed SpliceAI scores exist | SpliceAI weights non-commercial; reimplementations open | Delta score and position for each gain or loss |
| Feature-based (SPiP, SQUIRLS) | AUROC 0.830 and 0.806 (Drost) | Depends on bundled feature tools | CPU | Open source | Named features; SQUIRLS designed for this |
| Genomic foundation models (NTv3, Evo 2, Genos) | Below SpliceAI on 65 genes (Alavi, preprint) | Scores depend on context window, aggregation and strand rules | GPU for 10B to 40B parameter models | No splicing threshold supplied | Likelihood ratio, no site-level call |
| Tissue-aware (MMSplice, AbSplice) | No tabled RNA-validated comparison | Depends on tissue reference | CPU | Open source | Tissue-specific score |
| Count-based outlier callers (FRASER, FRASER 2.0, LeafCutterMD), detection baseline | Known-event recall from 0 of 67 to 13 of 16 across studies | Depends on cohort size, tissue and thresholds | Cohort of same-tissue samples | DROP pipeline | Junction-level effect sizes |
| Differential splicing and assembly (rMATS-turbo, MINTIE) | 15 of 23 and 8 of 23 events (Silverstein, preprint) | Depends on control set | Thousands of outliers per sample to review | Open source | Event type and reads |
Predicting the splicing effect: RNA-tested clinical variants
The most directly relevant predictor comparison comes from Mark Drost, Tjakko van Ham and colleagues in the Department of Clinical Genetics at Erasmus MC, Rotterdam, published in HGG Advances. Their diagnostic laboratory tested 202 variants for splicing effects between 2015 and 2023. Of the 179 tested in patient tissue by RT-PCR and Sanger sequencing, 58% used blood and 40% cultured fibroblasts, some with cycloheximide to block nonsense-mediated decay. 37 were tested by exon trapping. They developed none of the four predictors.
They merged their variants with 56 from the CAGI6 Splicing VUS challenge and kept the 243 that all four tools could score: 155 with a splicing effect and 88 without. AUROC was 0.895 for SpliceAI, 0.885 for Pangolin, 0.830 for SPiP and 0.806 for SQUIRLS. AUPRC was 0.943 for both SpliceAI and Pangolin, 0.889 for SPiP and 0.881 for SQUIRLS.
At thresholds taken from the literature, the picture is less comfortable.
| Predictor | Threshold | Sensitivity | Specificity |
|---|---|---|---|
| SpliceAI | 0.12 | 0.871 | 0.750 |
| Pangolin | 0.106 | 0.858 | 0.773 |
| SPiP | 0.452 | 0.832 | 0.761 |
| SQUIRLS | 0.018 | 0.800 | 0.591 |
| At least 2 of the 4 (authors' rule) | 0.916 | 0.727 |
Drost et al. 2025, Data S1 Tables S3 and S4, all 243 variants. Thresholds are from the paper's Results.
Requiring any one tool raised sensitivity to 0.961 but cut specificity to 0.409. Requiring all four gave 0.658 and 0.909. No threshold or combination made the RNA test unnecessary.
The negatives need care. Of the 202 in-house variants, 87% (176) were sent for RNA testing because Alamut Visual Plus predicted a splicing change. Most negatives are therefore variants that a prediction tool flagged and RNA did not confirm. This makes the test hard for every predictor, and the cohort is not a fair test of whichever tool chose the variants. There are no interval estimates. The tissue was chosen per gene, and the predictors do not model tissue.
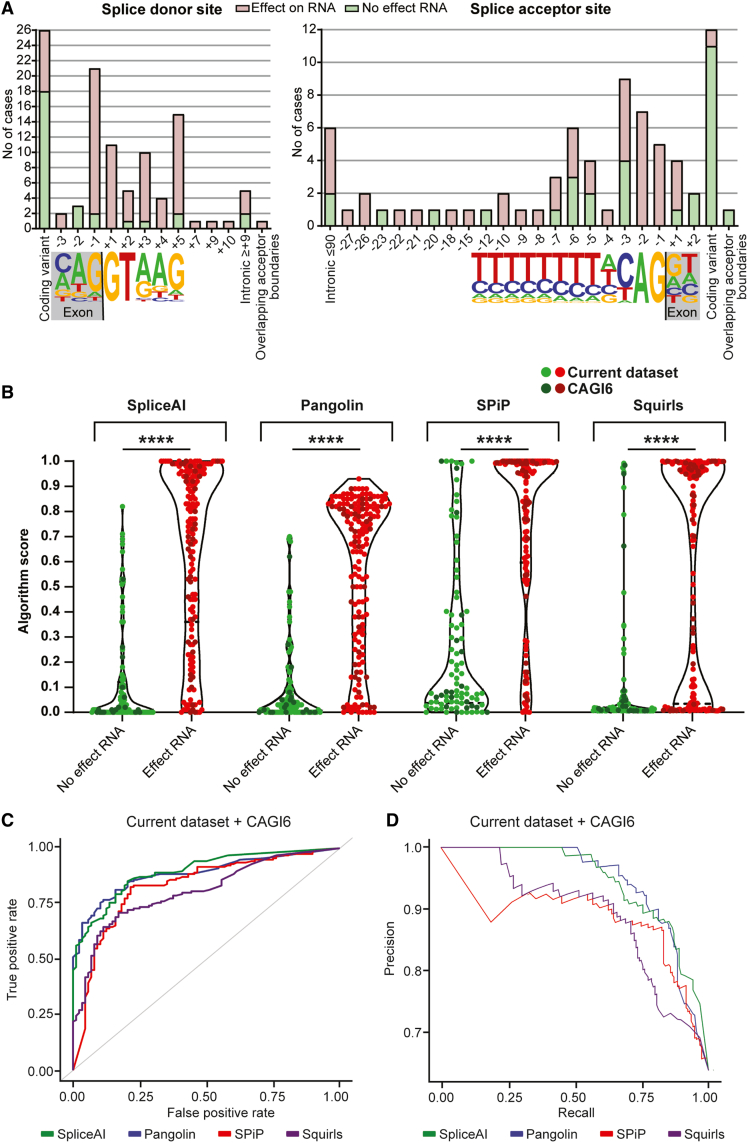
Figure 2 from Drost et al. 2025, HGG Advances, CC BY 4.0. Many variants with an RNA effect score near zero in every tool (panel B), which is why sensitivity at literature thresholds stays below 0.9.
Deep learning against motif scoring on the same variants
Nathan Fortier, Gabe Rudy and Andreas Scherer of Golden Helix, Bozeman, Montana, compared SpliceAI, CI-SpliceAI and OpenSpliceAI with a Legacy Ensemble in PLOS One. The ensemble is an N-of-4 vote across MaxEntScan, NNSplice, GeneSplicer and a SpliceSiteFinder-style matrix as supplied in Golden Helix's VarSeq software. The deep-learning rows are independent; the ensemble rows are developer-reported, because the authors' employer supplies those algorithms.
Four of the six benchmarks have experimental labels. On the 1,316-variant CI-SpliceAI set, balanced accuracy was 0.898 for SpliceAI and 0.785 for the ensemble. On 213 variants from functional splice assays in ABCA4 and MYBPC3 (Riepe et al.), it was 0.836 against 0.659. On the SPiP set, where about 2% of 99,601 variants are spliceogenic, it was 0.803 against 0.752, with F1 0.739 against 0.289. On 242 deep intronic pathogenic variants with 242 matched common controls (Barbosa et al.), it was 0.940 against 0.785.
The comparison leans in the baseline's favour on two sets. The ensemble's vote threshold was chosen per dataset for the highest balanced accuracy. The deep models used the standard 0.5 cut-off on the CI-SpliceAI and SPiP sets. On the Riepe and Barbosa sets all methods had thresholds tuned on the test data, so those values are upper bounds. Some labels are not independent of training: CI-SpliceAI was trained on all chromosomes, and its developers assembled the 1,316-variant set. ABCA4 is on a chromosome held out by both SpliceAI and OpenSpliceAI.
Among the deep models, SpliceAI led on three of the four sets. CI-SpliceAI had the highest balanced accuracy on its own developers' set, and OpenSpliceAI fell furthest behind on deep intronic variants (0.841). Labs choosing an open reimplementation to avoid SpliceAI's licence would accept a measurable loss on that variant class.
Foundation models against SpliceAI
Alavi, the single author of a bioRxiv preprint at 712 North Inc., is the only source that scores genomic foundation models against splice variants confirmed in patient RNA. The author developed none of the models. Thresholds were tuned on 49 OPA1 splicing variants and 79 benign variants, then applied unchanged to 76 spliceogenic canonical splice-site variants confirmed by RNA studies and 107 ClinVar benign intronic variants. The two sets span 65 genes; the benign variants fall in 46 of them.
| Model | Sensitivity | Specificity |
|---|---|---|
| SpliceAI | 88.2% | 99.1% |
| NTv3 650M, pretrained | 85.5% | 86.9% |
| Borzoi (32-bp) | 73.7% | 96.3% |
| Evo2 40B (human identifier) | 71.1% | 100% |
| AlphaGenome (either module) | 56.6% | 80.4% |
| Genos 10B | 27.6% | 85.0% |
Alavi 2026 (preprint), Table IV.
No foundation model matched SpliceAI on both measures. Evo2 40B made no false calls on the benign set but missed 22 of 76 spliceogenic variants. The positives are canonical splice-site changes only, the easiest class for any method. Genos 10B fine-tuned on ClinVar was scored against ClinVar benign controls, and overlap was not tested. Four printed accuracies in the preprint do not match their own counts. The scores depend on context windows and aggregation rules the author chose, so other choices could change the ranking.
Detecting aberrant splicing in patient RNA-seq
The first evidence comes from FRASER's developers, Christian Mertes, Julien Gagneur and colleagues at the Technical University of Munich, in Nature Communications. They used the Kremer cohort of skin-fibroblast RNA-seq from patients with rare mitochondrial disorders: 119 samples from 105 individuals, with 13 known pathogenic splicing events (Kremer et al. 2017). When they removed samples without a known event, FRASER still recovered a mean 85% (11 of 13) at 30 samples. Recovering all 13 regardless of which samples were kept needed 100. This measures recovery of known events by the tool's own authors, not discovery in unsolved cases, and no interval is printed.
Alba Segarra-Casas, Lidia González-Quereda, Pia Gallano and colleagues at IR Sant Pau, Barcelona, and Spanish rare-disease centres reported an independent comparison in Annals of Clinical and Translational Neurology. They sequenced 98 muscle biopsies from patients with suspected muscle disease and no diagnosis after exome sequencing, and found 16 pathogenic splicing events. FRASER at |dPSI| > 0.1 reported 13, FRASER at |dPSI| > 0.3 reported 9, FRASER2 reported 10 plus one more only when all samples were included, rMATS-turbo 7 and LeafCutterMD 4. OUTRIDER flagged the affected gene as an expression outlier in 7 of the 16. The events were found partly with these callers, so recall is measured on events at least one method could reveal. LeafCutterMD is not designed to report intron retention, which was part of five events.
Alexandre Segers, Lieven Clement and colleagues at Ghent University, the saseR developers, ranked 12 reported disease genes in the Kremer cohort, in Genome Biology. The gene ranked in the top 10 of its sample in 9 of 12 cases for saseR on junctions, 6 for FRASER 2.0 with the autoencoder and 7 for FRASER 2.0 with PCA. The saseR authors ran every method. The 12 genes come from earlier analyses of the same cohort with OUTRIDER and FRASER, and several are expression rather than splicing defects.
The only study that counts false outlier calls
Sarah Silverstein, Carsten Bönnemann and colleagues at the NINDS and the Undiagnosed Diseases Program, NIH, with collaborators, posted a benchmark of eight RNA-seq tools on medRxiv. It has not been peer reviewed. They used 97 previously diagnosed samples from paediatric neuromuscular patients: 68 known splicing variants in muscle, fibroblast and cycloheximide-treated fibroblast RNA-seq, and 21 true-negative samples whose pathogenic variants were not expected to change RNA. They did not develop the splicing callers. A true positive required an exact coordinate match and at least 3 split reads in manual review.
| Caller | Known events detected | Negative samples with any outlier | Tissue sets |
|---|---|---|---|
| rMATS-turbo | 15 of 23 | 9 of 9 | Muscle, fibroblast |
| MINTIE | 8 of 23 | 9 of 9 | Muscle, fibroblast |
| FRASER | 21 of 68 | 21 of 21 | Muscle, fibroblast, cycloheximide fibroblast |
| LeafcutterMD | 0 of 67 | 21 of 21 | Muscle, fibroblast, cycloheximide fibroblast |
| FRASER2.0 | 2 of 16 | 2 of 6 | Muscle only |
Silverstein et al. 2026 (preprint), Table S9. A negative sample with any reported outlier counts as one false positive.
Across all splicing tools, 24 of the 68 known splicing variants were detected. The sample-level scoring is harsh: one outlier anywhere in a negative sample counts the same as thousands. The authors say this overstates false-positive rates and that their event selection favours clearly defined events. Still, every caller except FRASER2.0 reported outliers in every negative sample it saw, so none of them yields a short list without further filtering. In the same paper, merging outliers from all tools except LeafcutterMD, keeping those at rare variants and then filtering by SpliceAI score left on average fewer than three candidates per muscle sample (Figure 2E).
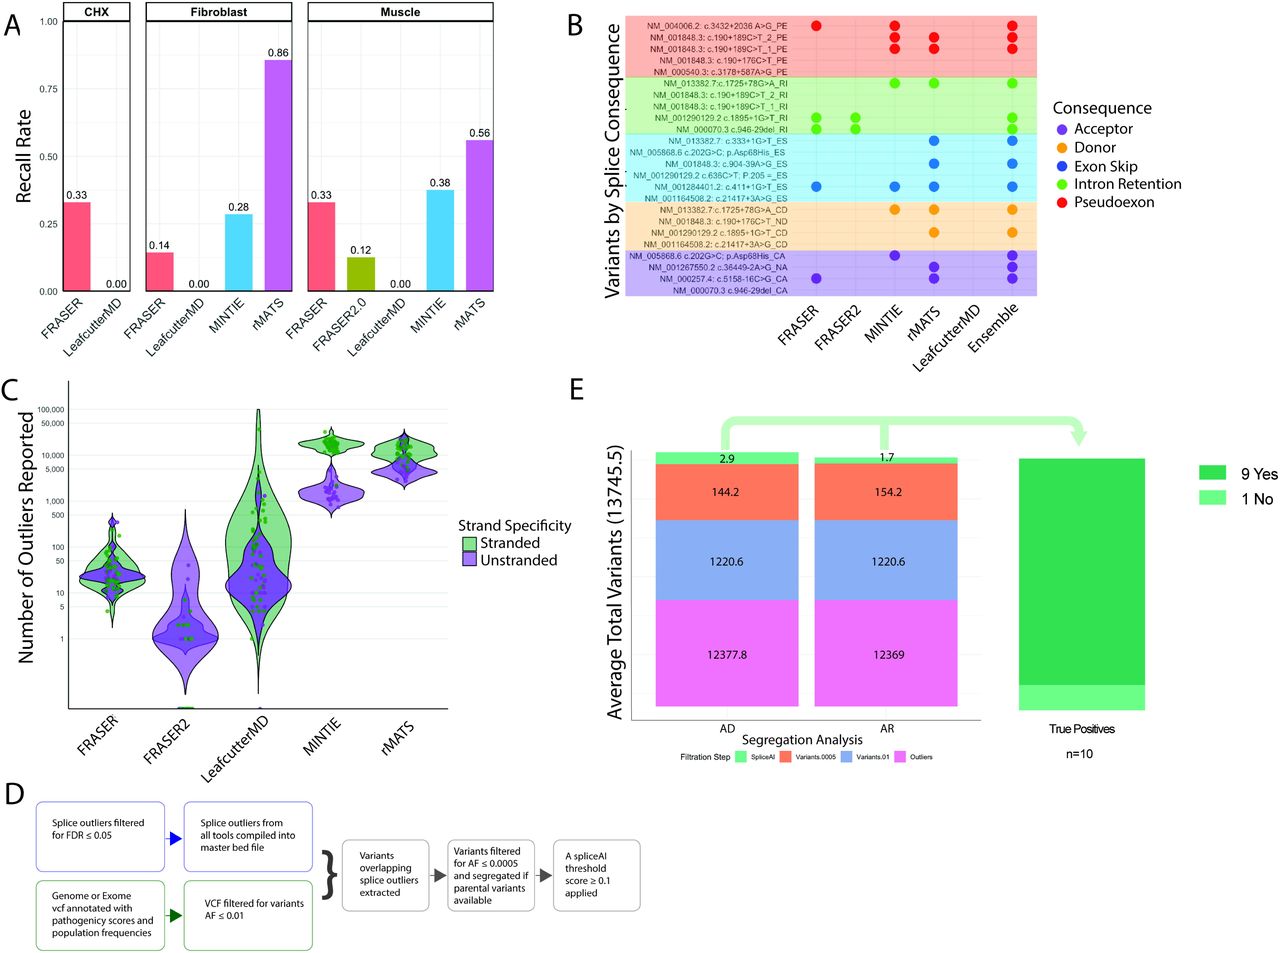
Figure 2 from Silverstein et al. 2026, medRxiv preprint, CC0 1.0. rMATS and MINTIE report thousands of outliers per sample (panel C); filtering by rare variants and SpliceAI score reduces the list (panel E).
FRASER's recall differs sharply between studies: 13 of 16 muscle events in Barcelona, 21 of 68 events at the NIH. Thresholds, cohort sizes and tissue mix differ, and 45 of the NIH events were in cycloheximide-treated fibroblasts. The two studies cannot be reconciled from the tables alone.
Why some studies only partly answer the question
Three of the four detection studies score events the field already knew, often found with the callers under test. That measures recall of findable events, not discovery. The Kremer results come from the FRASER and saseR developers. The NIH study is a preprint with tool-specific denominators.
On the prediction side, the Drost negatives were selected by motif scores, Fortier's thresholds were partly tuned on test data, and Alavi tests only canonical sites. Reporter assays such as MFASS measure exon inclusion in a minigene, outside native genomic context, and answer a different question from patient RNA; a separate post covers MFASS scores.
What has not been measured
- No study measures the diagnostic yield of a full workflow prospectively in patients without a known diagnosis.
- No tabled comparison scores MMSplice, CADD-Splice or AbSplice against RNA-validated variants. AbSplice reports its tissue-aware comparison only in figures.
- The FRASER 2.0 paper's comparison with FRASER, LeafCutterMD and SPOT on patient cohorts was not available in tabled form, and the MAJIQ-CLIN comparison of outlier tools could not be read in full.
- No multi-caller comparison covers blood RNA-seq, although blood was the most common tissue in the Drost cohort.
- Per-sample outlier counts appear only in figures. The NIH expression-outlier counts for OUTRIDER conflict between two supplementary tables.
- No study reports confidence intervals for per-tool recall or false-positive rates.
- No machine-learning or foundation-model RNA-seq caller has been compared with FRASER on the same samples, and no foundation model has been compared with motif scoring.
What this means for choosing a workflow
On current evidence, SpliceAI or Pangolin is the better way to decide which variants to send for RNA testing, and both beat motif scoring where it has been measured. A lab that cannot use SpliceAI's weights loses some accuracy with the open reimplementations, most on deep intronic variants. Genomic foundation models did not match SpliceAI in the one test available.
For RNA-seq, FRASER is the most tested caller. In the two independent studies it recovered 31% and 81% of known events. LeafCutterMD recovered few known events in both independent studies. rMATS-turbo recovered the most events at the NIH but produced the largest outlier lists. In the NIH study an ensemble of callers detected more events than any single caller (Figure 2B), and filtering against rare DNA variants and splice scores made the lists manageable.
What would change the picture
Three studies would help most. The first is a prospective cohort of undiagnosed patients run through several callers in blood, fibroblasts and muscle, with every candidate confirmed by RT-PCR. The second is a predictor comparison on RNA-tested variants not pre-selected by motif scores, with MMSplice, AbSplice and at least one foundation model, and with confidence intervals. The third is a same-sample test of any machine-learning RNA-seq caller against FRASER.
Until then, deep-learning predictors are the better triage tool, and RNA remains the test.
Per-tool values and source details for every study above are in the Inherited-disorder patient-RNA splicing validation use case.
Help improve this article
Found an error or a better source? Leave a note here, or highlight a passage to comment on it.