The strongest published accuracy figure for an RNA metagenomic workflow in respiratory testing is 93.6% sensitivity (103 of 110 positive specimens) for a UCSF assay, reported by its developers. No study compares several workflows prospectively against an adjudicated reference. The baseline method, nucleotide alignment as in SURPI+, has never been compared with a machine-learning classifier on clinical RNA specimens, so there is no evidence that machine learning improves on it.
Evidence tables: every comparison in this review, with per-tool values and source details, is on the RNA pathogen detection for diagnostic testing use case in the Rewire benchmark database.
The question is which RNA sequencing workflow detects pathogens reliably in respiratory specimens, and separates real detections from host and background signal. The input is respiratory RNA, DNase-treated and reverse-transcribed to cDNA libraries. The comparator is the clinical reference testing a laboratory already runs, usually multiplex PCR panels. Two preprints appeared recently. One is a prospective validation of a nanopore workflow from Oxford. The other is a developer benchmark of five virus profilers from the EsViritu team. Neither closes the main gap.
What the evidence can and cannot support
The literature supplies a sensitivity figure against original clinical testing for one respiratory metagenomic assay. It does not support a general accuracy claim for RNA virus detection. Each study below has its own truth set and scoring rules, so tools can be compared within a study but not across studies.
The baseline
The baseline for this use case is nucleotide alignment of non-human reads to the full NCBI nucleotide database (nt), as in SURPI+ and CZ ID. Each read is aligned to reference genomes, and a pathogen is reported when enough reads align to it and its count exceeds the background in negative controls. This is the established algorithmic method for clinical metagenomics. SURPI+ was the analysis pipeline of the first clinically validated metagenomic assay, for cerebrospinal fluid (Miller et al. 2019), and it is the only workflow in this review with a peer-reviewed clinical validation on respiratory RNA (93.6% sensitivity, Tan et al. 2024). Kraken2 is the most frequent comparator in the multi-tool studies (Carbo et al. 2022, Tisza et al. 2026), so it serves as the reference point inside those studies, but it trades alignment evidence for speed.
The baseline is not the truth. The truth in these studies is the clinical reference test, usually a multiplex PCR panel. The baseline is the conventional pipeline that any newer method has to beat on the same specimens and the same reference.
| Method | Family | Baseline | Result against the baseline | Study |
|---|---|---|---|---|
| SURPI+ | Nucleotide alignment to nt | Yes, baseline | Baseline: 93.6% sensitivity (103 of 110), developer-reported | Tan et al. 2024 |
| CZ ID | Nucleotide alignment to nt and nr | Yes, same family | Not compared with SURPI+ on the same specimens | Kalantar et al. 2020 |
| Kraken2 | k-mer, no machine learning | No; in-study reference | 22 or 23 of 24 PCR positives with Kaiju, Centrifuge, CLARK and Genome Detective; not compared with SURPI+ or CZ ID | Carbo et al. 2022 |
| Metabuli, EsViritu | k-mer; virus profiler, no machine learning | No | Higher detection than Kraken2 at 10 read pairs (0.9998 and 0.974 against 0.045); developer benchmark on synthetic data; not compared with alignment to nt | Tisza et al. 2026 |
| LucaProt | Deep learning | No | Never compared with the baseline; no clinical specimen study | Hou et al. 2024 |
Sources: the studies linked in this review. Results in different rows come from different studies and are not comparable across rows.
No machine-learning or deep-learning classifier has been scored against the baseline on the same specimens and reference. None of the tools named in the Carbo or Tisza comparisons is a machine-learning classifier.
Method families and their tradeoffs
Most RNA metagenomic workflows share the same wet-lab steps and read pre-processing. They differ mainly at the classification step, and in the rule that turns read counts into a reported detection.

Where each method family sits in an RNA metagenomic workflow. Tools named are representative examples.
Nucleotide alignment pipelines
SURPI+ trims reads, removes low-complexity and human reads, then aligns the rest to NCBI nt with SNAP at an edit distance of 16 (Tan et al. 2024). Unaligned reads can be assembled with SPAdes and the contigs searched against viral proteins with DIAMOND. A detection needs at least 3 non-overlapping viral reads or contigs. Bioinformatic analysis took about 1 hour within a 14 to 24 hour sample-to-answer time. The paper gives no CPU or memory specification. SURPI+ includes proprietary algorithms covered by a US patent, and access is through University of California licensing. CZ ID (formerly IDseq), as described in 2020, removes host reads with STAR and Bowtie2, aligns to nt with GSNAPL and to nr with RAPSearch2, and assembles contigs with SPAdes (Kalantar et al. 2020). It scores each taxon's reads per million against a background model built from water or other negative controls, as a z-score. Benchmark samples took a mean of 3 hours (1.6 to 10) on pipeline v3.13. The code is open source and the service is hosted in the cloud. Both pipelines report reads aligned to named accessions, which a reviewer can inspect.
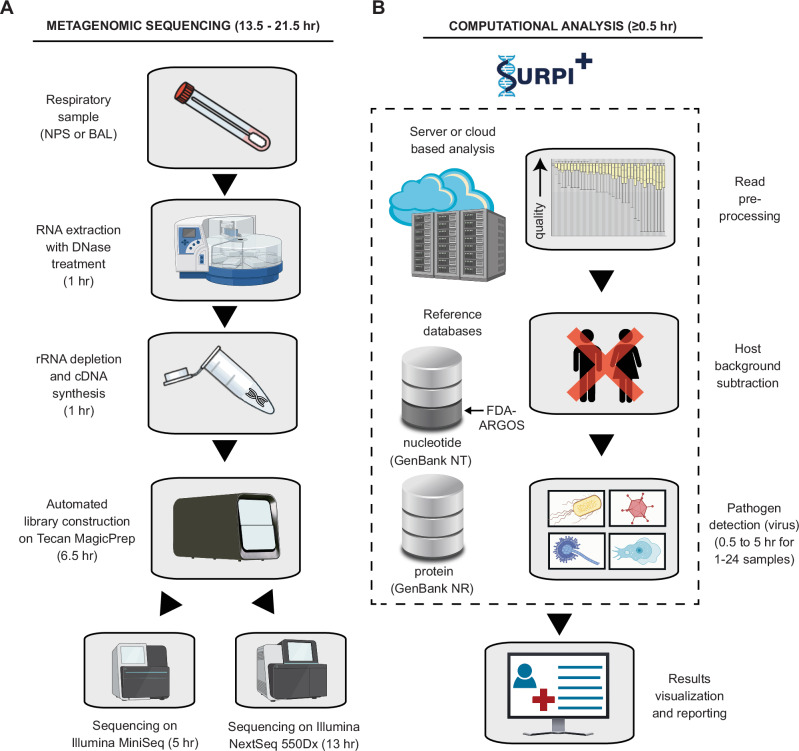
Figure 1 from Tan et al. 2024, Nature Communications, CC BY 4.0.
k-mer classifiers
Kraken2 reduces each 35-mer in a read to a 31-base minimizer and looks it up in a compact hash table that maps minimizers to the lowest common ancestor of the genomes that contain them (Wood et al. 2019). Each read is assigned to the end of the highest-scoring path in the taxonomy. For a 9.1 Gbp reference, Kraken2 used 10.6 GB of memory against 72.4 GB for Kraken 1, and classified over 93 million paired-end reads per minute on 16 threads. Metabuli builds "metamers" that combine amino acid and DNA k-mers from six-frame translation (Kim and Steinegger 2024). Amino acid matches give sensitivity to divergent sequence; DNA mismatches separate close relatives. Its developers state that 8 GiB of RAM suffices for most analyses (repository). On deep wastewater data in the EsViritu benchmark, Metabuli always needed substantially more memory than the other four tools. The output is a taxon per read, decided by shared k-mers rather than an alignment, so the evidence behind a single call is harder to inspect.
Virus-specific profilers
EsViritu aligns reads with minimap2 to its Virus Pathogen Database of 19,925 genomes from 63 families, about 400 MB decompressed (repository). Reads must align over at least 90% of their length, at 80% or higher identity, over at least 100 nt. Iterative clustering then picks one reference per group of related strains, and genomes are rebuilt from the reads. The report gives coverage breadth and the consensus identity to the nearest reference. Its developers report that it runs on a couple of CPUs and a few GB of RAM, but took 2 to 8 times longer than the other four tools. VirMAP combines BBMap nucleotide mapping and DIAMOND protein mapping to GenBank viral and phage divisions with MEGAHIT or Tadpole assembly, then scores contigs by bit-score per base before a lowest-common-ancestor step (Ajami et al. 2018). That paper does not report runtime or memory.
Translated search
DIAMOND indexes both query and reference on the fly with multiple spaced seeds, then extends hits with banded Smith-Waterman alignment (Buchfink et al. 2021). In ultra-sensitive mode it matched BLASTP sensitivity with an 80-fold speedup and used less than 16 GB of RAM. Protein-level matching tolerates more nucleotide divergence than nucleotide alignment. In the RNA workflows reviewed here it is a secondary step inside SURPI+ and VirMAP, not a standalone classifier, and no cited study scores it alone on clinical RNA specimens.
Panel-restricted read matching
The Oxford workflow basecalls with Dorado, removes human reads with Kraken2 and Deacon, trims SISPA primers, and maps the remaining reads with minimap2 to a composite reference of the 23 panel pathogens (Sanderson et al. 2026). A detection uses coverage, depth and read-fraction thresholds fixed on the derivation set. The code is public. Analysis ran after sequencing, not in real time, though the authors state it can run on GridION onboard computing. By design it cannot report pathogens outside the panel.
Commercial platforms
Illumina's DRAGEN Metagenomics app classifies reads with Kraken2 against built-in databases dated March 2020 and May 2021, after host removal with DRAGEN Map/Align, and handles up to 100 million reads per sample (Illumina). DRAGEN Microbial Enrichment Plus supports the Respiratory Pathogen ID/AMR enrichment panel of more than 280 RNA and DNA pathogens, with k-mer classification and alignment-based detection (Illumina). Both are commercial products.
Deep-learning virus discovery
LucaProt, a model that combines protein sequence with predicted structure, found 161,979 potential RNA virus species in 10,487 metatranscriptomes from diverse ecosystems (Hou et al. 2024). It targets divergent RNA polymerase sequences for discovery. I found no study scoring a deep-learning classifier against clinical reference testing on respiratory RNA specimens. LucaProt has never been compared with the baseline, nucleotide alignment to nt, on the same data. Its developers evaluated it on a held-out set of known viral and non-viral polymerase protein sequences (repository), not on reads from clinical specimens.
| Family (examples) | Accuracy evidence | Reproducibility | Compute | Ease of use | Interpretability |
|---|---|---|---|---|---|
| Nucleotide alignment (SURPI+, CZ ID); baseline | 93.6% sensitivity for SURPI+, developer-reported; none independent for either on RNA | Fixed database date (SURPI+ March 2019 nt); CZ ID hosted versions (v3.13 in 2020) | About 1 h analysis (SURPI+); mean 3 h per sample (CZ ID 2020) | SURPI+ licensed; CZ ID hosted, open code | High: reads aligned to named accessions |
| k-mer (Kraken2, Metabuli) | Kraken2 22 to 23 of 24 PCR positives, many PCR-negative calls (Carbo); Metabuli sensitive but 18 median false species (Tisza) | Results depend on database build and confidence settings, which Tisza varied in grids | Kraken2 10.6 GB for 9.1 Gbp reference; Metabuli higher memory in Tisza | Open source (Metabuli GPL-3.0) | Low to moderate: shared k-mers, no alignment |
| Virus profilers (EsViritu, VirMAP) | EsViritu 0 median false species, developer benchmark on synthetic data | Versioned database (EsViritu v3.2.4) | EsViritu few CPUs and GB, 2 to 8 times slower | Open source | High: coverage breadth and consensus identity |
| Translated search (DIAMOND) | Not scored alone on clinical RNA | Set by sensitivity mode and database version | Under 16 GB RAM ultra-sensitive | Open source, GPL3 | Moderate: protein hits to accessions |
| Panel-restricted mapping (Oxford) | 51% sensitivity, 99.8% specificity, developer-reported | Thresholds fixed before validation; public code | GridION onboard computing | Open code, panel-specific | High within panel; blind outside it |
| Commercial (DRAGEN) | No independent RNA-specimen comparison found | Vendor-versioned databases | BaseSpace cloud app, up to 100 million reads per sample | Licensed, integrated | Organism detection report and Krona chart |
| Deep learning (LucaProt) | No diagnostic accuracy study; never compared with the baseline | Fixed weights | Not reported for diagnostic use | Discovery tool, not a clinical pipeline | Low |
Sources: the papers and documentation linked in this section. Accuracy cells summarise the studies reviewed below.
The single-assay results
Jessica Tan, Charles Chiu and colleagues at the University of California, San Francisco, report 93.6% sensitivity (103 of 110) against original clinical respiratory virus panel testing in Nature Communications. The workflow is RNA isolation with DNase, rRNA depletion and cDNA synthesis, Tecan MagicPrep library preparation, Illumina MiniSeq or NextSeq sequencing, and SURPI+ analysis against a March 2019 NCBI viral reference augmented with SARS-CoV-2. The cohort was 110 positive and 81 negative residual specimens.
The figure has limits that matter for reuse. It is developer-reported. No confidence interval is given for it. The target mix includes adenovirus, a DNA virus detected through its transcripts, so it is not an RNA-virus-only score. Out-of-panel metagenomic calls were not counted as false positives. The paper's Results and Methods also disagree on how the positive specimens split between BAL and swabs (104 and 6 against 103 and 7). A composite agreement figure printed after discrepancy adjudication (98.7%, 110.5 of 113) is arithmetically inconsistent, and I have set it aside.
Nicholas Sanderson and colleagues at the University of Oxford and Oxford University Hospitals evaluated their own nanopore RNA metagenomic workflow on 344 prospectively collected nasopharyngeal swabs, in a medRxiv preprint. Of these, 273 passed quality control and 71 did not. With detection thresholds fixed on a separate derivation set, the workflow detected 51% (133 of 260) of PCR-positive targets. Sensitivity ranged from 85% for RSV to 19% for rhinovirus/enterovirus. Specificity was 99.8%.
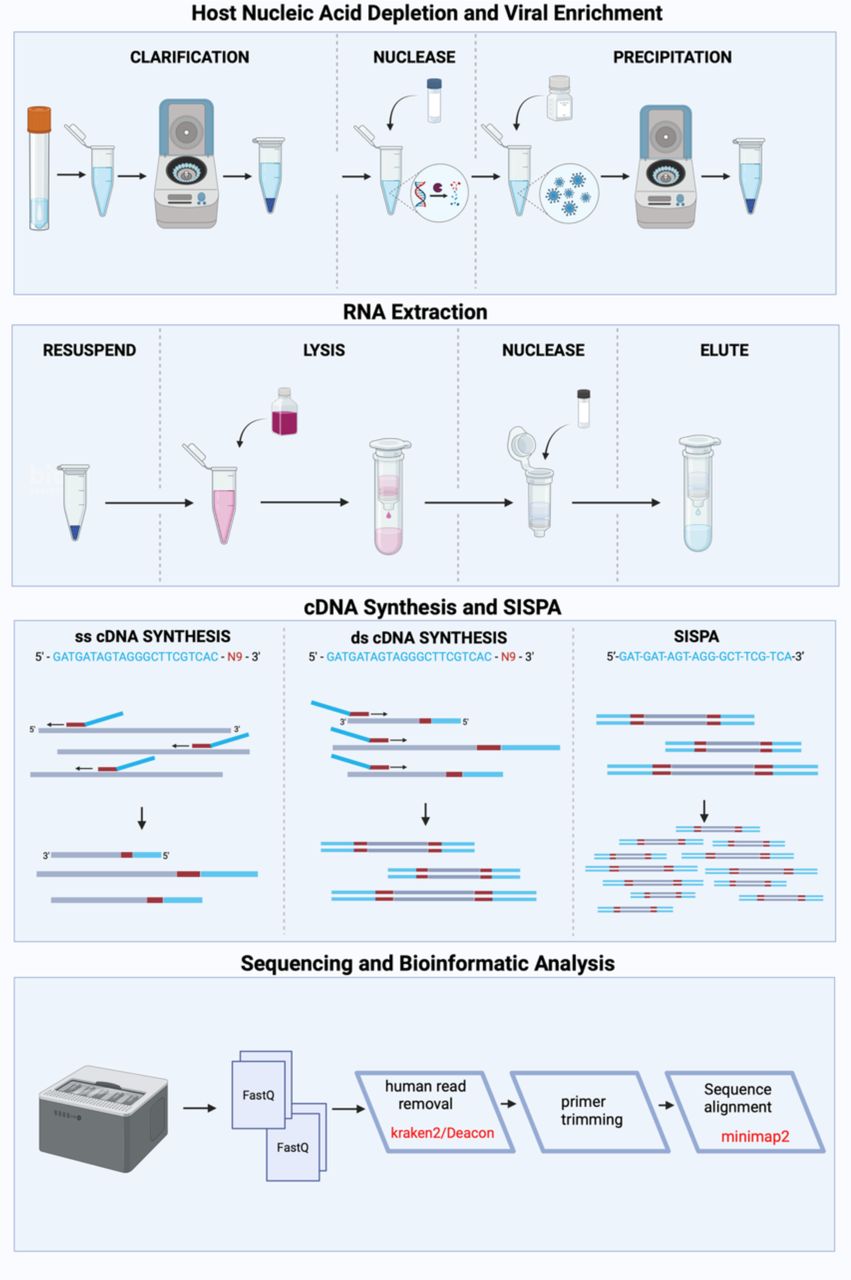
Figure 1 from Sanderson et al. 2026, medRxiv preprint, CC BY 4.0.
The authors attributed all nine false positives to barcode crossover in multiplexed runs. Detection criteria chosen after the validation raised sensitivity to 58%, with specificity of 99.9%. Under that post-hoc criterion, sensitivity was 83% for targets with study qPCR Ct below 35.
Two design features limit what the 51% means. Inclusion required a pathogen at Ct 30 or below on the four-target assays, or FilmArray testing, with about one FilmArray-negative swab per eight positives. Sensitivity and specificity are therefore not estimates for unselected swabs. Reads were mapped only to a database restricted to the 23 panel pathogens, so the study does not measure detection outside the panel. The Abstract and Results also give different specificity counts (3836 of 3845 against 3901 of 3910).
| Study | Who measured | Specimens and truth set | Headline result |
|---|---|---|---|
| Tan et al. 2024, UCSF SURPI+ | Developers, peer-reviewed | 110 positive, 81 negative residual respiratory specimens; original clinical panel | 93.6% sensitivity (103 of 110) |
| Sanderson et al. 2026, Oxford nanopore | Developers, preprint | 344 swabs, 273 passing QC; routine multiplex PCR | 51% sensitivity (133 of 260), 99.8% specificity |
| Carbo et al. 2022, five classifiers | Independent, peer-reviewed | 88 nasal washings; 1144 PCR results, 24 positive | 22 or 23 of 24 detected; 31% to 58% of positive calls PCR-negative |
| de Vries et al. 2021, 13 lab pipelines | Independent, preprint | 13 clinical datasets, 5 respiratory; RT-PCR | 10 to 13 of 13 samples correct |
| Meyer et al. 2022, CAMI II | Challenge organisers | One blood metagenome | 4 of 10 submissions listed the causal virus |
| Tisza et al. 2026, five profilers | Developers, preprint | Synthetic reads and pathogen-free libraries | Family detection probability at 10 read pairs from 0.0009 to 0.9998 |
Sources: the primary studies linked in the text. Each row uses its own reference and scoring; rows are not comparable.
Comparisons of several workflows
Three multi-workflow studies exist. Each answers the question only in part, because of its specimens, library preparation or design.
Ellen Carbo and colleagues at Leiden University Medical Center, working independently of the tool developers, ran Kaiju, Centrifuge, CLARK, Kraken2 and Genome Detective on 88 nasal washings from one COPD cohort, scored against 1144 respiratory virus PCR results (Pathogens 2022). At species level, the five classifiers detected 22 or 23 of the 24 PCR-positive results. However, 31% to 58% of their positive calls were PCR-negative. The read-count cut-off was chosen from the ROC on the same 1144 results, so these figures are optimistic for a new cohort. Libraries were prepared with a combined RNA and DNA protocol, not DNase-treated RNA input. The per-tool values are from the preprint supplement.
The European Network for NGS in Diagnostics (ENNGS) asked 13 European clinical virology laboratories to run their own pipelines on the same 13 clinical datasets (de Vries et al. 2021, preprint). Between 10 and 13 samples were correctly called positive. DNAstar, FEVIR and MetaMix found every sample and reported 6, 2 and 0 additional PCR-negative viruses respectively. Each laboratory used its own reference database and reporting rules, so tool and database effects cannot be separated. Only 5 of the 13 samples were respiratory, and 5 of the 15 PCR-positive targets were DNA viruses. It was a dry-lab exercise, without routine wet-lab steps or confirmatory PCR.
In the CAMI II clinical pathogen challenge (Meyer et al. 2022), 4 of 10 submissions listed Crimean-Congo haemorrhagic fever virus, the causal pathogen, in one blood metagenome, and 3 named it as causal. This is a single non-respiratory sample, and the causal role of the virus was the most plausible explanation rather than a proven one.
The new profiler benchmark
Michael Tisza and colleagues at Baylor College of Medicine, the developers of EsViritu, compared five virus profilers on one shared Virus Pathogen Database in a bioRxiv preprint. They built the data, chose the comparators' parameter grids and headline settings, and ran every tool.
| Tool | Family detection probability, 10 read pairs | Recall, 100 read pairs | Median false species, 7 pathogen-free libraries | Species F1, mock communities |
|---|---|---|---|---|
| Metabuli v1.2.0 | 0.9998 | 100.0% | 18 | 0.692 |
| EsViritu v1.3.1 | 0.974 | 99.9% | 0 | 0.845 |
| Kraken2 v2.17.1 | 0.045 | 58.9% | 6 | 0.632 |
| Centrifuger v1.1.1 | 0.012 | 19.8% | 0 | 0.579 |
| Sylph v0.9.0 | 0.0009 | 0.347% | 0 | 0.499 |
Developer benchmark, Tisza et al. 2026, Tables S2, S6 and S9. Detection probability is model-estimated at the authors' headline settings. F1 is the strict species-rank mean over six mutated mock communities.
The positive controls were reads from seven divergent virus genomes, at 75.9% to 95.6% average nucleotide identity to the nearest reference. At 10 read pairs, Metabuli and EsViritu almost always reported the correct family; Kraken2, Centrifuger and Sylph rarely did. In the negative controls, Metabuli reported a median of 18 false species (maximum 71), against 0 for EsViritu (maximum 1).
The relevance to RNA diagnostics is limited. Three of the seven positive-control genomes are Picornaviridae, which are RNA viruses; the other four are DNA viruses, and results are not split by genome type. Only one of the seven pathogen-free libraries is RNA-derived. There are no clinical specimens and no reference laboratory test. Because every tool used the same database, the comparison isolates the algorithm, not each tool as it would usually be deployed.
What has not been measured
- No independent study compares CZ ID (IDseq), SURPI+, DRAGEN or VirMAP against other workflows on RNA specimens with per-tool values.
- No study compares workflows on an RNA virus spike-in or reference material.
- The UCSF sensitivity figure has no confidence interval, and the paper's BAL and swab counts disagree.
- The COMPARE in silico proficiency test (Brinkmann et al. 2019) scores two divergent RNA viruses, but participants are anonymised and not linked to named tools, so it cannot inform a choice between pipelines.
- No study compares workflows prospectively on a large cohort with an adjudicated composite reference standard.
Practical implications
A laboratory choosing a workflow cannot rely on published head-to-head accuracy, because none exists for RNA specimens under clinical conditions. The developer figures show what a well-run assay can achieve on selected specimens. They do not predict performance on unselected samples in another laboratory. Local validation against the laboratory's own PCR panels remains necessary, with attention to low-titre specimens, barcode crossover in multiplexed runs, and false positives in negative controls.
What would change the picture
Three kinds of study would change the assessment. The first is an independent, prospective comparison of several workflows on unselected respiratory specimens, scored against an adjudicated composite reference and reporting confidence intervals. The second is a shared RNA reference material or spike-in panel run through named pipelines, so that wet-lab and database choices can be separated from the classifier. The third is a published head-to-head of the commercial and widely deployed platforms listed above.
None of these studies yet includes a machine-learning method set against the baseline. Until results of that kind exist, the published numbers describe individual assays on selected cohorts, and the multi-tool comparisons answer the clinical question only in part.
Per-tool values and source details for each study are in the RNA pathogen detection for diagnostic testing use case.
Help improve this article
Found an error or a better source? Leave a note here, or highlight a passage to comment on it.