No published study compares DNA pathogen identification workflows independently on patient specimens against a reference standard that sequencing did not help build. The patient-specimen numbers that exist are reported by the authors who built or supplied the assays, and most head-to-head tool comparisons use mock communities or constructed metagenomes.
Evidence tables: every comparison in this review, with per-tool values and source details, is on the DNA pathogen identification for diagnostic testing use case in the Rewire benchmark database.
The practical question for a laboratory is which DNA metagenomic classification workflow detects clinically relevant pathogens, and how it behaves with contaminating DNA and with organisms absent from its reference database. This review covers seven published comparisons that bear on that question. The most recent are Hu et al. 2026, Huang et al. 2026, Wolf et al. 2026 and Tisza et al. 2026.
The question and the reference standard
The typical input is plasma microbial cell-free DNA (cfDNA) sequencing reads, scored against whatever reference standard a laboratory has, such as blood culture or a composite clinical adjudication.
The figure that can be defended is narrow: positive percent agreement against one named reference standard, with that reference's own detection limits stated. It is not sensitivity against all true infections. That distinction matters for every number below, because the choice of reference changes what each figure means.
Classification method families and their trade-offs
A shotgun DNA workflow has the same outline whatever the classifier. DNA is extracted, sometimes after wet-lab host depletion, and sequenced. Reads are quality filtered and aligned to a human reference so host reads can be removed. The remaining reads go to a classifier and its reference database. A contamination step then compares the result with negative controls, a background model or a read threshold before anything is reported.

Six families of classifier appear in the studies above.
Exact k-mer matching
Kraken 2 breaks each read into minimizers and looks them up in a compact hash table that maps each one to the lowest common ancestor of the genomes containing it. The read is assigned to the taxon best supported by its hits. On a 9.1 Gbp reference, Kraken 2 used 10.6 GB of memory against 72.4 GB for Kraken 1, and its authors report it is five times faster. Bracken then redistributes reads stuck at higher ranks to estimate species abundance. Kraken2 and Bracken had the lowest species-level precision in Portik et al. 2022.
FM-index matching
Centrifuge indexes genomes with a Burrows-Wheeler transform and FM-index and scores variable-length exact matches. Its index was 4.2 GB for 4,078 bacterial and 200 archaeal genomes. Centrifuger compresses the index further: 41 GB for RefSeq prokaryotic genomes, about half the memory of other FM-index methods. Its authors found Kraken2 fastest, with Centrifuger about three times slower than Centrifuge on one thread.
Sketch containment
sylph keeps about one in 200 k-mers (k = 31) from each genome and from the sample. A zero-inflated Poisson model corrects containment ANI for low coverage. It reports genomes and abundances, not a label per read. Its developers report under one minute and 16 GB of memory against 85,205 prokaryotic and 2,917,516 viral genomes. They also report over ten-fold less CPU time and 30-fold less memory than Kraken2 for multisample profiling.
Marker genes
MetaPhlAn 4 maps reads with Bowtie 2 to 5.1 million marker genes for 26,970 species-level genome bins. Its authors state that it does not extensively cover viral or eukaryotic sequences, which limits its diagnostic use. In Portik et al. 2022, MetaPhlAn3 assigned only 23 to 39% of reads.
Nucleotide alignment
BugSeq aligns reads with minimap2 to RefSeq microbes, the human genome and a contaminant database. It reassigns reads by mapping quality and then applies a lowest common ancestor step. It runs as a cloud service, free for non-commercial use. Every call rests on an alignment that can be inspected.
Protein alignment
DIAMOND aligns translated reads to protein databases. Its developers report BLAST-level accuracy with an 80 to 360-fold speed-up. MEGAN-LR assigns long reads from frame-shift aware protein alignments. Protein search can place divergent organisms whose DNA has drifted from the reference.
Hosted pipelines
Hosted services chain these steps. IDseq, now CZ ID, was described with host subtraction, a background model and spike-in controls. Its current open-source workflow filters host reads with Bowtie2 and HISAT2 and aligns with minimap2 to NCBI NT and DIAMOND to NR. Running it locally with full NT and NR needs more than 1 TB of disk and 64 GB of RAM. The Karius test is a commercial service run in the developer's laboratory, and its classifier is not published in a form that can be examined.
Neural network classifiers
Neural network classifiers have been tested only by their developers, on simulated or mock data. BERTax uses a BERT model trained on DNA and reports better results than database methods for organisms with no close relative in training. MetageNN uses short k-mer profiles of nanopore reads and reports a 23% read-level gain over Kraken2 when genomes are missing from the database. Neither has a published evaluation on clinical specimens, and I found no genomic foundation model with one.
The baseline
The baseline here is alignment-based classification against a curated reference: reads aligned with minimap2 at the nucleotide level (BugSeq) or with frame-shift aware protein alignment (MEGAN-LR), followed by a lowest common ancestor step. It is the best performing conventional method in the cited comparisons. In Portik et al. 2022, MEGAN-LR and BugSeq-V2 called 0 to 2 absent species where Kraken2 and Bracken called 44 to 204, and every call rests on an alignment that can be checked. Kraken2 is the most widely used conventional classifier and the usual comparator in machine learning papers, but it had the lowest species-level precision in that study, so it is not the baseline. The baseline is not the truth. The truth is the clinical reference standard, such as blood culture or an adjudicated diagnosis, against which both the baseline and any newer method are scored.
Each machine learning method against the baseline, in the same study:
- MetageNN was compared with MEGAN-LR and Kraken2 on the same nanopore reads, at genus level, in its developers' paper. For 34 bacterial isolates whose species were absent from the 516-genome database, it reported read-level improvements of 36% over MEGAN-LR and 23% over Kraken2. MEGAN-LR still had significantly higher precision on those reads. For species present in the database, MEGAN-LR, Kraken2 and MetaMaps had better F1 than MetageNN, and on pseudo-mock communities MEGAN-LR had the best precision at every threshold. MetageNN beat the baseline only on sensitivity for missing genomes.
- BERTax was compared with minimap2, MMseqs2, Kraken2 and sourmash on the same DNA fragments in its developers' paper. When no genus from the test set was in the reference, minimap2 classified 19.88% of sequences and Kraken2 21.56%. BERTax raised macro average precision from 67.47% to 90.06% at superkingdom and from 43.44% to 54.10% at phylum, compared with the best database method, a modified MMseqs2 taxonomy run. With related genomes in the reference, the authors report only slightly higher precision. BERTax predicts superkingdom, phylum and genus, not species, so it does not make the species-level call a pathogen report needs.
- No genomic foundation model has been compared with the baseline on the same pathogen identification data.
| Method | Family | Baseline | Result against the baseline | Study |
|---|---|---|---|---|
| MEGAN-LR, BugSeq-V2 | Alignment | Yes (baseline) | 0 to 2 absent species called | Portik et al. 2022 |
| Kraken2, Bracken | Exact k-mer | No | 44 to 204 absent species called; more false calls than the baseline | Portik et al. 2022 |
| MetageNN | Neural network | No | Higher read-level sensitivity for missing species (36% over MEGAN-LR); lower precision; lower F1 for species in the database | Developers, 2024 |
| BERTax | Neural network (transformer) | No | Higher average precision than minimap2 and MMseqs2 for unseen genera at superkingdom and phylum; no species-level calls | Developers, 2022 |
| Genomic foundation models | Neural network | No | Not compared | None found |
Both comparisons are developer-reported and use non-clinical data. No machine learning method has been compared with the baseline on patient specimens against a clinical reference standard.
The reference database
The reference database can matter as much as the family. Hall and Coin 2024 moved one tool from 0.07 to 0.995 of reads correct by changing it. They note that the standard kraken database uses upward of 65 GB of memory. Wright and colleagues concluded that default databases and parameters for Kraken2 should not be used.
Trade-offs by family
| Family (tools) | Baseline | Accuracy in cited studies | Reproducibility | Compute | Ease of use | Interpretability |
|---|---|---|---|---|---|---|
| Exact k-mer (Kraken2, Bracken) | No | High recall; many false species at low thresholds | Results change with database and parameters (Wright 2023) | 10.6 GB for 9.1 Gbp reference; fastest in Centrifuger tests | Open source (MIT, GPL-3.0) | Per-read taxon, no alignment |
| FM-index (Centrifuge, Centrifuger) | No | Median 0 false virus species (Centrifuger, Tisza) | Read assignment varied with minimum hit length (Portik) | 41 GB index for RefSeq prokaryotes | Open source (Centrifuger MIT) | Per-read taxon with match score |
| Sketch (sylph, sourmash) | No | Median 0 false virus species (sylph, Tisza) | Profiles genomes above 95% ANI by default | Under 1 min, 16 GB | Open source (sylph MIT) | Genome-level ANI, no per-read label |
| Marker genes (MetaPhlAn) | No | MetaPhlAn3 assigned 23 to 39% of reads (Portik); little viral or eukaryotic coverage | Versioned marker database, at least two releases a year planned | Bowtie 2 against markers only | Open source (MIT) | Marker coverage per clade |
| Nucleotide alignment (minimap2, BugSeq) | Yes (baseline) | BugSeq-V2 0 to 2 false species (Portik) | BugSeq database updated monthly; version must be recorded | Large indexes; CZ ID full run 64 GB RAM | BugSeq hosted, free non-commercial | Full alignments per read |
| Protein alignment (DIAMOND, MEGAN-LR) | Yes (baseline) | MEGAN-LR 0 to 2 false species (Portik) | Depends on NR release; IDseq tracked index version per run | 80 to 360-fold faster than BLAST at similar accuracy | Open source (GPL-3.0) | Protein alignments per read |
| Neural network (BERTax, MetageNN) | No | Developer-reported, non-clinical only | Depends on training data and released weights | MetageNN under a quarter of Kraken2 storage | Developer research tools, no clinical pipeline | Little; no alignment evidence |
Plasma cell-free DNA: one commercial assay, culture as reference
The anchor result comes from the developers of the Karius plasma cfDNA test. Blauwkamp and colleagues at Karius report 93.7% (59 of 63) positive agreement with initial blood culture in a prospective sepsis-alert cohort of 350 patients (348 paired results). The assay reports 1,250 organisms and is DNA only, so RNA viruses are out of scope. Positive agreement with culture is not sensitivity, because blood culture misses infections. The paper does not state the exact software and database version, and its negative agreement interval against the composite reference is given two different ways (54.8 to 70.0 and 55.2 to 70.4).
The newer Karius data come from Joshua Wolf and colleagues at St Jude Children's Research Hospital, in children and young adults with high-risk leukaemia. Karius provided testing and took part in sample processing, analysis and data management, and one author is a Karius employee. On the day of or after onset, the test found every blood-culture organism in 81.3% (65 of 80) of evaluable bloodstream infection episodes. In the three days before onset it did so in 51.9% (42 of 81).
Specificity in the same study came from 162 control samples from patients without fever or infection: 82.7% (134 of 162) had no bacterium or yeast detected. A cut-off of 140 molecules per microlitre raised that to 90.7%, but the cut-off was chosen post hoc on the same data. Burkholderia was also excluded after the fact because of possible local contamination. There is no comparator workflow on the same samples.
Both studies use a selected population and culture as the main reference. They show how one assay agrees with culture; they do not show how it compares with other workflows.
Two workflow comparisons on patient specimens
Two recent studies compare more than one sequencing approach on the same patients. Both are author-reported and peer reviewed, and both use a reference standard that depends partly on sequencing.
Hu and colleagues, at the First Affiliated Hospital of Xi'an Jiaotong University and other centres, compared a short-read MGI workflow with a host-depleted nanopore (ONT) workflow on 62 bronchoalveolar lavage (BALF) specimens. Eight authors, including co-corresponding author Lifeng Li, are affiliated with Genskey Medical Technology, a clinical mNGS provider; the article declares no conflict of interest.
Against routine culture, both workflows had 95.2% positive agreement. Negative agreement was 44.6% for the MGI workflow and 46.4% for the nanopore workflow, because both found organisms that culture did not. Against a composite reference that adds organisms found by both workflows, positive agreement was 93.3% and 90.7%. That composite favours the sequencing workflows by construction. Only the culture comparison is independent of the sequencing results. The two workflows also differ in platform, library preparation, host depletion, aligner and positivity threshold at once, so this compares whole workflows, not classifiers.
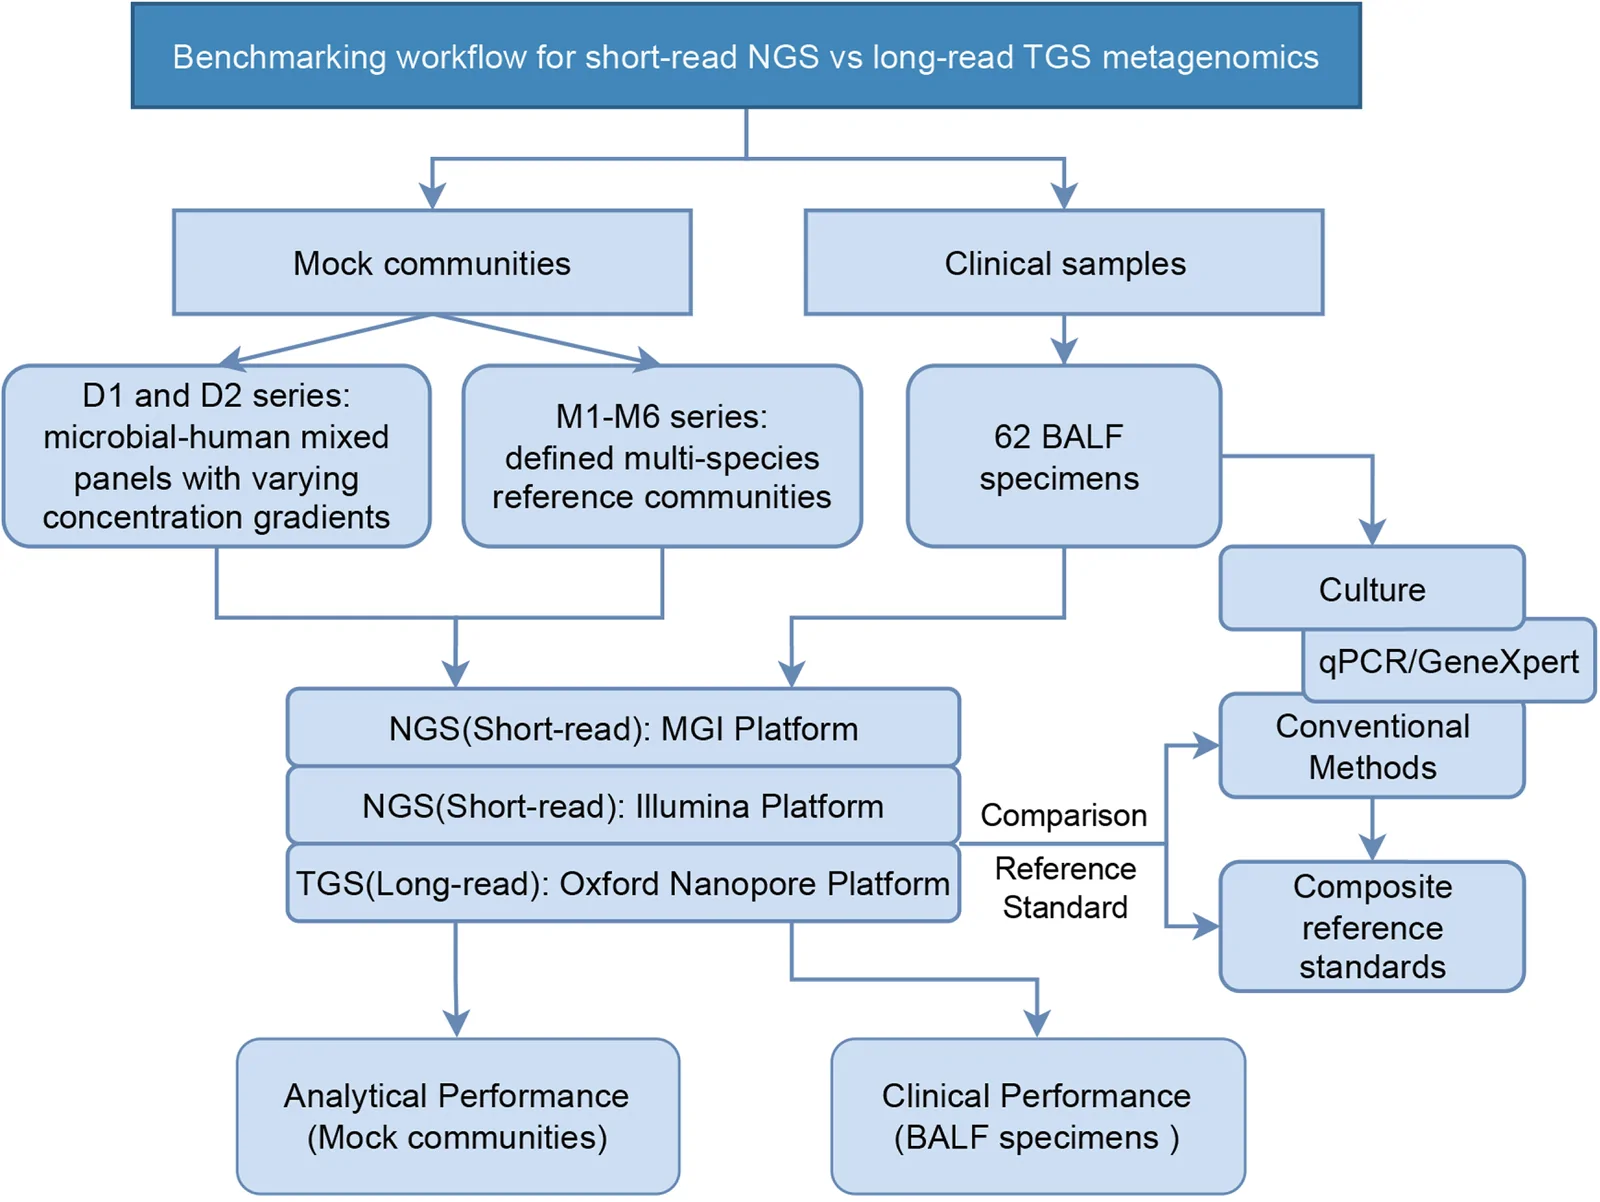
Fig 1 from Hu et al. 2026, Microbiology Spectrum, CC BY 4.0. The clinical arm compares whole workflows against culture and a composite reference.
Huang and colleagues at the First Affiliated Hospital of Sun Yat-sen University studied 122 intensive-care patients with pneumonia-associated sepsis. They scored a targeted probe-capture assay on plasma (bstNGS), untargeted blood mNGS, conventional microbiological tests and blood culture against an adjudicated clinical diagnosis. Two co-authors are from Geneplus-Beijing, which supplies the targeted assay's probes; no competing interests are declared.
| Test (Huang et al. 2026, 122 patients) | Sensitivity | Specificity |
|---|---|---|
| Targeted plasma cfDNA (bstNGS) | 63.46% | 44.44% |
| Conventional microbiological tests | 49.04% | 88.89% |
| Untargeted blood mNGS | 35.58% | 61.11% |
| Blood culture | 9.62% | 100.00% |
The reference in this study was built mainly from BALF mNGS and from the conventional tests that are themselves scored, which favours the conventional tests. Few patients were reference-negative, and the specificity interval for bstNGS runs from 24.56% to 66.28%. The cohort is retrospective and single-centre, with 61 of 183 screened patients excluded. The targeted panel cannot detect organisms outside its 1,872 probes, which is directly relevant to organisms absent from the reference.
Classifier comparisons on mock and constructed data
The remaining three comparisons test classification software rather than whole assays. They speak to contamination and false positives, but none uses a clinical specimen. Mock communities and constructed metagenomes have a known truth, which makes scoring clean, but they lack host background, low-biomass contamination and the strain diversity of real samples.
| Study | Data | Tools | Key result |
|---|---|---|---|
| Portik et al. 2022 | Mock communities, PacBio HiFi, ONT and Illumina | 14 configurations incl. Kraken2, Bracken, MEGAN-LR, BugSeq-V2, sourmash | Kraken2 and Bracken called 44 to 204 absent species at a 0.001% read threshold (precision 0.05 to 0.21); MEGAN-LR and BugSeq-V2 called 0 to 2 |
| Tisza et al. 2026 (preprint) | Seven pathogen-free libraries; reads from seven divergent virus genomes | EsViritu, Centrifuger, Sylph, Kraken2, Metabuli on one shared virus database | Median false virus species: 0 for EsViritu, Centrifuger and Sylph; 6 for Kraken2; 18 for Metabuli |
| Hall and Coin 2024 | Constructed M. tuberculosis metagenomes, Illumina and Nanopore | kraken and minimap2 with three databases each | kraken standard database classified 0.07 to 0.74 of M. tuberculosis reads correctly; with a Mycobacterium database, 0.97 to 0.995 |
Daniel Portik of Pacific Biosciences and colleagues ran each method with its own reference database, so method and database effects are mixed. The first author is a PacBio employee and the MEGAN-LR workflows are PacBio's. Two co-authors wrote the sourmash papers, so the sourmash rows are author-reported. The authors note that the 0.001% threshold penalises methods that assign fewer reads; at 0.1%, short-read false positives fell from several hundred to about 10 or fewer.
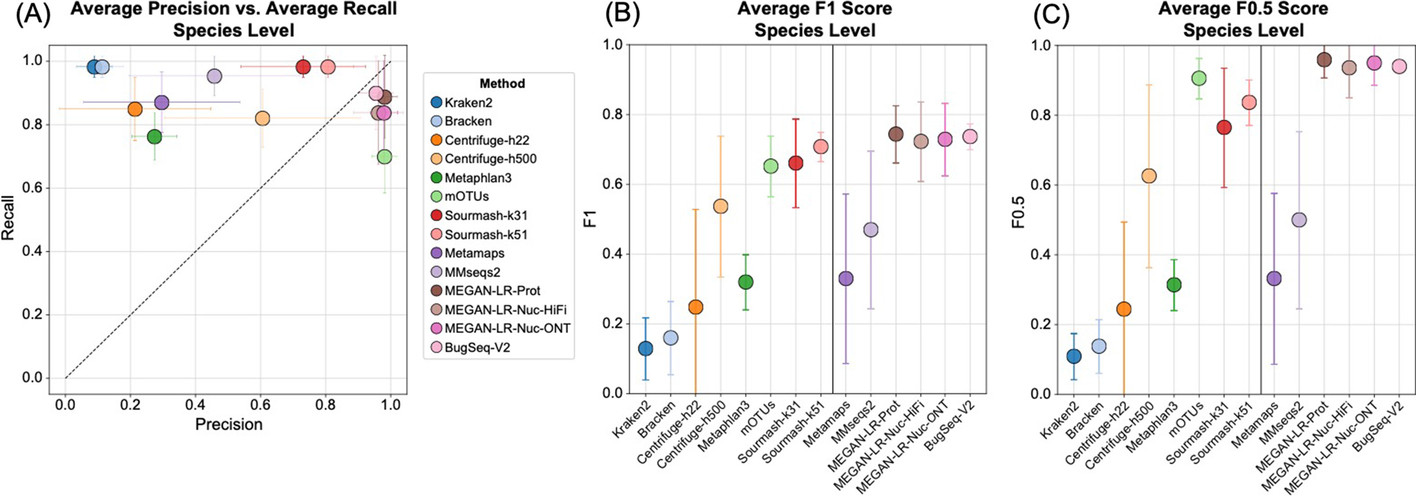
Figure 4 from Portik et al. 2022, BMC Bioinformatics, CC BY 4.0. Species-level averages at a 0.001% read threshold; each method used its own database.
Michael Tisza and colleagues at Baylor College of Medicine developed EsViritu and ran every tool themselves, choosing the comparators' parameter grids and headline settings. The results are a bioRxiv preprint, not peer reviewed. Holding the database constant isolates the algorithms, but it does not reflect how each tool is usually deployed. The trade-off runs both ways: Metabuli had the most false species in negative controls but the highest modelled family-level detection probability at 10 read pairs on divergent genomes (99.9819%, against 97.4431% for EsViritu and 4.5124% for Kraken2). The study covers viruses only.
Michael Hall and Lachlan Coin at the Peter Doherty Institute built the Mycobacterium databases themselves, so those configurations are author-reported, while the kraken standard databases are independent. The metrics are per read, for one pathogen. At least 90% of the reads kraken missed at species rank were correct at genus rank, so species-level sensitivity understates genus-level detection.
Who ran each comparison
Most results come from the people who built or sold the workflow being tested:
- Blauwkamp et al. 2019 (Karius): developer-reported, peer reviewed.
- Wolf et al. 2026: author-reported with Karius involvement, peer reviewed.
- Hu et al. 2026 and Huang et al. 2026: author-reported, with co-authors from sequencing companies, peer reviewed.
- Portik et al. 2022: mostly independent, with sourmash author-reported and a PacBio first author, peer reviewed.
- Hall and Coin 2024: independent for the standard kraken databases, author-reported for their own databases, peer reviewed.
- Tisza et al. 2026: developer benchmark, preprint.
Each study used its own reference database, positivity threshold and reporting rules. Comparing tools within one study is reasonable; comparing numbers across studies is not.
Implications for choosing and validating a workflow
In my judgement, three points follow for a laboratory choosing a workflow.
- Database choice can matter as much as the classifier. Hall and Coin 2024 show a single tool moving from 0.07 to 0.995 of reads correct when the database changes.
- Thresholds trade false positives against sensitivity. Portik et al. 2022 and Tisza et al. 2026 both show that low read thresholds produce many absent species, and that the tool with the fewest false calls is not always the most sensitive.
- Published agreement figures do not transfer. Each is tied to one population, one specimen type and one reference standard, so a laboratory has to validate locally, with negative controls to measure its own contamination background.
What has not been measured
- There is no independent comparison of CZ ID, SURPI, DRAGEN Microbial or BugSeq on clinical DNA specimens with published per-tool values.
- Detection of organisms absent from the reference is tested only indirectly, through two species missing from several databases in Portik et al. 2022 and the M. tuberculosis database comparison in Hall and Coin 2024. No clade-exclusion benchmark focused on pathogens has been published with extractable values.
- The only earlier patient-sample comparison of classifiers, Song et al. 2025 on bloodstream infection, has unresolved questions about its Kraken values. It has five culture-positive samples of one organism group and reports abundances, not detection calls.
- No machine learning classifier has been compared with the alignment baseline on clinical specimens, and no genomic foundation model has been compared with it at all.
- Lao et al. 2024 report per-pipeline culture concordance for 213 sterile body fluids only in prose, without tabulated values. LEMMI, the CAMI Benchmarking Portal and Govender and Eyre 2022 report values in figures only.
What would change the picture
Three kinds of study would give a direct answer. The first is an independent comparison of several workflows on the same clinical specimens, against a reference that does not include the sequencing results being scored. The second is a clade-exclusion benchmark, where pathogen genomes are removed from the reference to test how each workflow handles organisms it has never seen. The third is a protocol with a prospectively adjudicated composite reference standard rather than initial blood culture alone.
Until then, the available numbers describe agreement with a stated reference in a stated population, as reported mostly by the people who built or sold the workflow. None of these results is clinical validation. The best machine learning result, MetageNN, beat the alignment baseline only on read-level sensitivity for species missing from the database, with lower precision, in its developers' own non-clinical test.
Per-tool values and source details for each study are in the DNA pathogen identification for diagnostic testing use case.
Help improve this article
Found an error or a better source? Leave a note here, or highlight a passage to comment on it.