Whole-genome methylation was the strongest single cell-free DNA (cfDNA) feature in the one study that compared features on the same participants. It detected 34% of cancers at 98% specificity and placed the tissue of origin better than copy number or mutations. Higher sensitivities come from smaller case-control cohorts with internal splits. No machine-learning method has clearly beaten the established baseline on the same data.
Evidence tables: every comparison in this review, with per-method values and source details, is on the Plasma ctDNA detection from methylation use case in the Rewire benchmark database.
The practical question is which methylation workflow detects tumour-derived DNA in plasma and, once a cancer signal is found, which tissue it comes from. Labs choose between whole-genome bisulfite or enzymatic methyl-seq, targeted bisulfite capture, and cfMeDIP-seq, which enriches methylated fragments with an antibody. They then choose an analysis: marker scores, deconvolution against a reference atlas, a trained classifier, or a deep model. This review covers seven published comparisons. Four were run by the developers of the assay or classifier, three by groups who did not develop the methods, and two are preprints. Truth in every patient study is clinical cancer status from diagnosis; in the mixture study it is the tumour fraction the authors spiked in. I did not rerun any method, and values from different studies cannot be pooled.
How methylation workflows detect and locate cancer

Assays, analysis families and the outputs each family produces. Diagram by the author.
Marker and region scores. Tumour DNA carries hypermethylated CpG islands and broad hypomethylation that blood cells do not. Marker methods count reads or regions that show these patterns. Methylation haplotype load scores how often adjacent CpGs on one read are co-methylated (Guo et al. 2017). Read-level methods such as CancerDetector (Li et al. 2018) flag individual fragments whose pattern matches tumour rather than normal tissue. These scores are rarely used alone; most studies feed them to a classifier.
Reference-based deconvolution. cfDNA is a mixture of DNA from many cell types. Deconvolution treats each sample's methylation as a weighted sum of reference profiles from purified cell types and solves for the weights. MethAtlas uses non-negative least squares over marker CpGs (Moss et al. 2018). Houseman's constrained projection is a least-squares fit with the weights constrained to sum to one (Houseman et al. 2012). CelFiE fits methylated and total read counts by expectation maximisation and can estimate unknown components (Caggiano et al. 2021). UXM counts the share of fully unmethylated fragments at marker regions (Loyfer et al. 2023). The output is a fraction per cell type: the tumour or affected-tissue fraction is the detection signal, and the tissue with excess signal is the origin. None of these methods learns from labelled patients.
Classical classifiers. These learn a decision rule from labelled cancer and control samples. Elastic net logistic regression, linear and kernel SVMs, random forests and gradient boosting are all used on DMR counts, CpG beta values or principal components. GRAIL's whole-genome classifier removes fragments with methylation states common in non-cancer samples, scores the remaining fragments by cancer likelihood and passes the top scores to kernel logistic regression (Jamshidi et al. 2022). cfMethyl-Seq stacks linear SVMs on several marker types under a random forest (Stackpole et al. 2022).
Deep learning and methylation foundation models. Feedforward networks and graph convolutional networks have been trained on combined methylation and fragment features. CpGPT is a transformer pretrained on large collections of methylation array data, which can be fine-tuned for a classification task (de Lima Camillo et al. 2024). It was pretrained on array data from tissues, not on cfDNA sequencing.
The baseline
The task has two parts, and only one of them has a method that predates machine learning. For tumour fraction and tissue of origin, the baseline is reference-based deconvolution by constrained least squares, as in MethAtlas and Houseman's constrained projection. It needs no training labels, it is the method most deconvolution tools extend, and it appears in both deconvolution benchmarks below. CelFiE is a probabilistic refinement of the same idea, not a learned classifier.
For a yes/no cancer call there is no pre-machine-learning method in the evidence. Every detection result comes from a trained classifier. The conventional comparator is a penalised linear model on DMR CpGs, such as elastic net logistic regression, and I treat that as the detection baseline. In CCGA substudy 1 the best conventional comparator is machine learning itself: every classifier there is trained, from kernel logistic regression for methylation to a convolutional network for copy number. That study compares features, not algorithms.
The baseline is not the truth. Truth is a clinical cancer diagnosis, or the known tumour fraction in a simulated mixture. A newer method beats the baseline only if it scores better against the same truth on the same data.
| Method | Family | Baseline | Result against the baseline in the same study | Study |
|---|---|---|---|---|
| meth_atlas (NNLS), Houseman constrained projection | Reference-based deconvolution | Yes (tumour fraction, origin) | Overall median limit of detection 0.0250 and 0.0100 (WGBS mixtures), 0.0250 and 0.0250 (RRBS mixtures) | Giuili et al. (independent of tools, preprint) |
| CIBERSORT (support vector regression) | Machine-learning deconvolution | No | Worse: 0.2500 (WGBS), 0.1000 (RRBS) | Giuili et al. |
| CelFiE | Probabilistic deconvolution | No | Better: 0.0070 (WGBS), 0.0100 (RRBS) | Giuili et al. |
| Elastic net on 20,499 DMR CpGs | Penalised linear classifier | Yes (detection) | Test AUROC 0.9420 (95% CI 0.8587 to 1.0000) | Xu and Feng (baseline built by the authors, preprint) |
| CpGPT, fine-tuned | Methylation foundation model | No | Higher point estimate, 0.9904 (0.9715 to 1.0000); intervals overlap; features chosen using test samples | Xu and Feng (independent of CpGPT, preprint) |
| SVM, gradient boosting, random forest | Classical machine learning | No | 0.9573, 0.8460 and 0.8408 | Xu and Feng |
| DNN and graph network for tissue of origin | Deep learning | No | Never compared with deconvolution on the same samples | None |
| Whole-genome methylation classifier (CCGA) | Classical machine learning | No | Compared with other trained classifiers on other features, not with a baseline | Jamshidi et al. (developer) |
Limits of detection are overall medians across sequencing depths from Giuili et al. 2025, Supplementary Table 3; lower is better. AUROCs are means over three split-runs from Xu and Feng 2026, Table 3.
So on the same data, machine-learning deconvolution did worse than least squares, and the one foundation-model result above elastic net is too small and too leaky to count as a win.
| Family (tools) | Accuracy | Reproducibility | Compute | Ease of use | Interpretability |
|---|---|---|---|---|---|
| Marker and region scores (DMR counts, haplotype load) | Not compared alone in these studies | Depends on marker discovery cohort | Low | Needs a marker set per assay | High: named regions |
| Reference-based deconvolution (NNLS, constrained projection, CelFiE, UXM), baseline | Limits of detection from 0.0010 to 0.2500 across tools and datasets | Deterministic given a reference atlas; results depend on the atlas and marker selection | CPU; CelFiE iterative | Open source; needs a reference atlas matched to the assay | High: fraction per cell type |
| Classical classifiers (elastic net, SVM, random forest, kernel logistic regression) | 34% at 98% specificity in CCGA; AUROC 0.84 to 0.96 in Xu and Feng | Depends on training cohort and threshold choice | CPU | Standard libraries | Moderate: coefficients or importances |
| Deep learning (DNN, graph networks) | Tissue of origin 0.69 in SPOT-MAS validation | One developer study; graph network saw validation samples | GPU helpful | Custom code | Low |
| Methylation foundation models (CpGPT) | Test AUROC 0.9904 in one preprint | One study, three splits | GPU for fine-tuning | Public checkpoint; fine-tuned weights not yet released | Low |
The one same-participant comparison: CCGA substudy 1
Arash Jamshidi and colleagues at GRAIL, with clinical investigators from the Mayo Clinic, the Francis Crick Institute and other centres, compared prototype cfDNA classifiers in the first substudy of the Circulating Cell-free Genome Atlas, published in Cancer Cell. Every assay was run on the same blood draws: whole-genome bisulfite sequencing at about 30x, a 507-gene targeted panel, and 30x whole-genome sequencing, each with matched white-blood-cell sequencing to remove clonal haematopoiesis. GRAIL built and ran every classifier, and most authors were GRAIL employees.
The validation set held 464 solid cancers and 362 non-cancer participants. The classifiers were locked before unblinding, and the 98% specificity threshold was set post hoc within each set, giving an observed specificity of 97.8%.
| Classifier | Feature | Sensitivity, validation | Cancers detected |
|---|---|---|---|
| WG methylation | Whole-genome bisulfite | 34% (30% to 39%) | 158 of 464 |
| SNV-WBC | Variants, white-blood-cell corrected | 33% (29% to 38%) | 155 of 464 |
| SCNA-WBC | Copy number, white-blood-cell corrected | 30% (26% to 34%) | 139 of 464 |
| SCNA | Copy number | 27% (23% to 31%) | 125 of 464 |
| SNV | Variants | 16% (13% to 20%) | 75 of 464 |
| Clinical data | Age, smoking, family history | 2.6% (1.4% to 4.5%) | 12 of 457 |
Jamshidi et al. 2022, Table 3, validation set; 95% Clopper-Pearson intervals. Paired McNemar tests against WG methylation were significant for every row except SNV-WBC.
Methylation led, but only just ahead of corrected variants, and the margin depends on removing clonal haematopoiesis from the variant classifier. In training cross-validation the methylation classifier reached 39%, so it lost five points on the held-out set. Four further classifiers, including one combining all features, were built after the validation set was unblinded and are not a blinded comparison.
The more important finding is about what drives detection. Circulating tumour allele fraction, estimated from tumour biopsy variants, was the only significant predictor of detection in a model that also included cancer type and stage, and it explained 72% of the variance in methylation classifier scores. Stage was significant only when tumour fraction was left out. Detection is limited by how much tumour DNA is in the blood, and every feature faces the same limit.
GRAIL later moved from whole-genome to targeted methylation. In the same paper, the targeted test's clinical limit of detection at 98% specificity was 1.3 x 10^-4 tumour allele fraction, measured on 559 participants from the second substudy. That is a different assay on different samples, so it is not a same-data comparison, but the authors report it as almost an order of magnitude better than the prototypes.
Tissue of origin among detected cancers
Jamshidi et al. also built origin classifiers for three features and scored them on the 127 validation cancers that all three detection classifiers had called. The methylation origin classifier assigned the correct tissue for 75% (95 of 127), against 41% for copy number and 35% for corrected variants. The origin classifiers were developed after unblinding, the label "other" was counted as correct for six cancer types, and the 127 cancers are by construction the ones with the most tumour DNA. These numbers are an upper range for people whose cancer would actually be detected.
Mary Stackpole, Wenyuan Li, Xianghong Jasmine Zhou and colleagues at UCLA, the cfMethyl-Seq developers, reported 89.1% origin accuracy (95% CI 73.9% to 96.9%) across colon, liver, lung and stomach cancers, and 85.0% for stage I and II, in Nature Communications. Four tissue classes make the task easier than CCGA's.
Nguyen and colleagues at Gene Solutions in Ho Chi Minh City, the SPOT-MAS developers, compared three origin classifiers in eLife. Their input combined targeted and genome-wide methylation with fragment length, copy number and end motifs from one bisulfite library, so this is not a methylation-only test. On an independent validation cohort of 239 non-metastatic patients with breast, colorectal, gastric, liver or lung cancer, overall accuracy was 0.53 for a random forest, 0.69 for a feedforward network and 0.69 for a graph convolutional network. Per-cancer accuracy for the graph network ranged from 0.55 for gastric to 0.78 for breast. Most authors were affiliated with Gene Solutions, and the graph network was trained on a graph that included the validation samples as nodes.
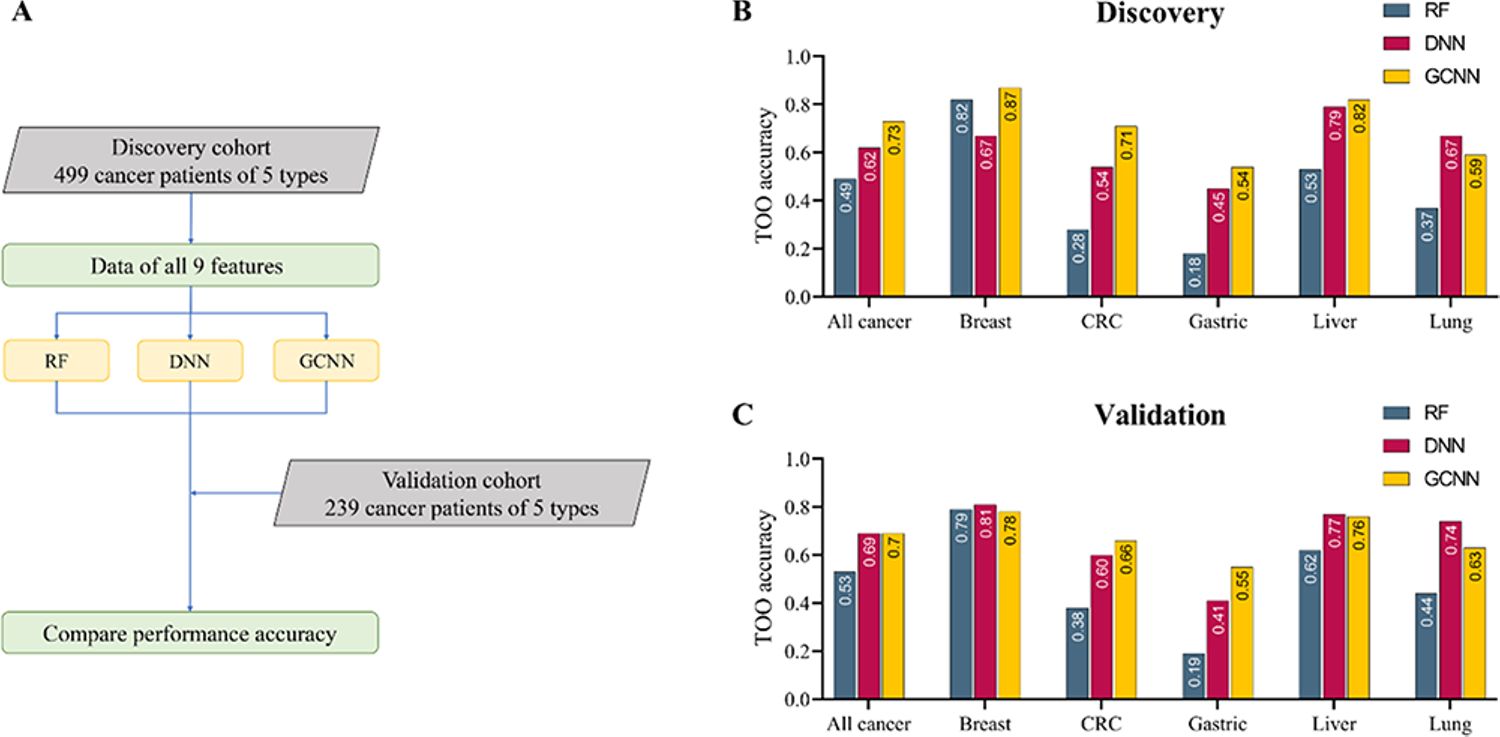
Figure 8, figure supplement 1 from Nguyen et al. 2023, eLife, CC BY 4.0. The random forest falls furthest behind on colorectal and gastric cancer. The figure labels the validation graph-network accuracy 0.7; the supplementary table prints 0.69.
No study here measures origin calls in people without cancer, and none compares a trained origin classifier with reference-based deconvolution on the same samples.
cfMethyl-Seq on repeated random splits
The cfMethyl-Seq assay enriches CpG islands from cfDNA at lower cost than whole-genome bisulfite sequencing. Stackpole et al. applied it to 408 plasma samples that passed quality control: 217 colon, liver, lung and stomach cancers and 191 non-cancer participants, some with other diseases. Over 10 random 75:25 splits, the stacked classifier reached 80.7% all-stage sensitivity (95% CI 68.6% to 90.7%) at one false positive, or 97.9% specificity, with a test set of about 102 samples per run. Early-stage (I and II) sensitivity was 74.5%, and 54% of the cancers were early stage.
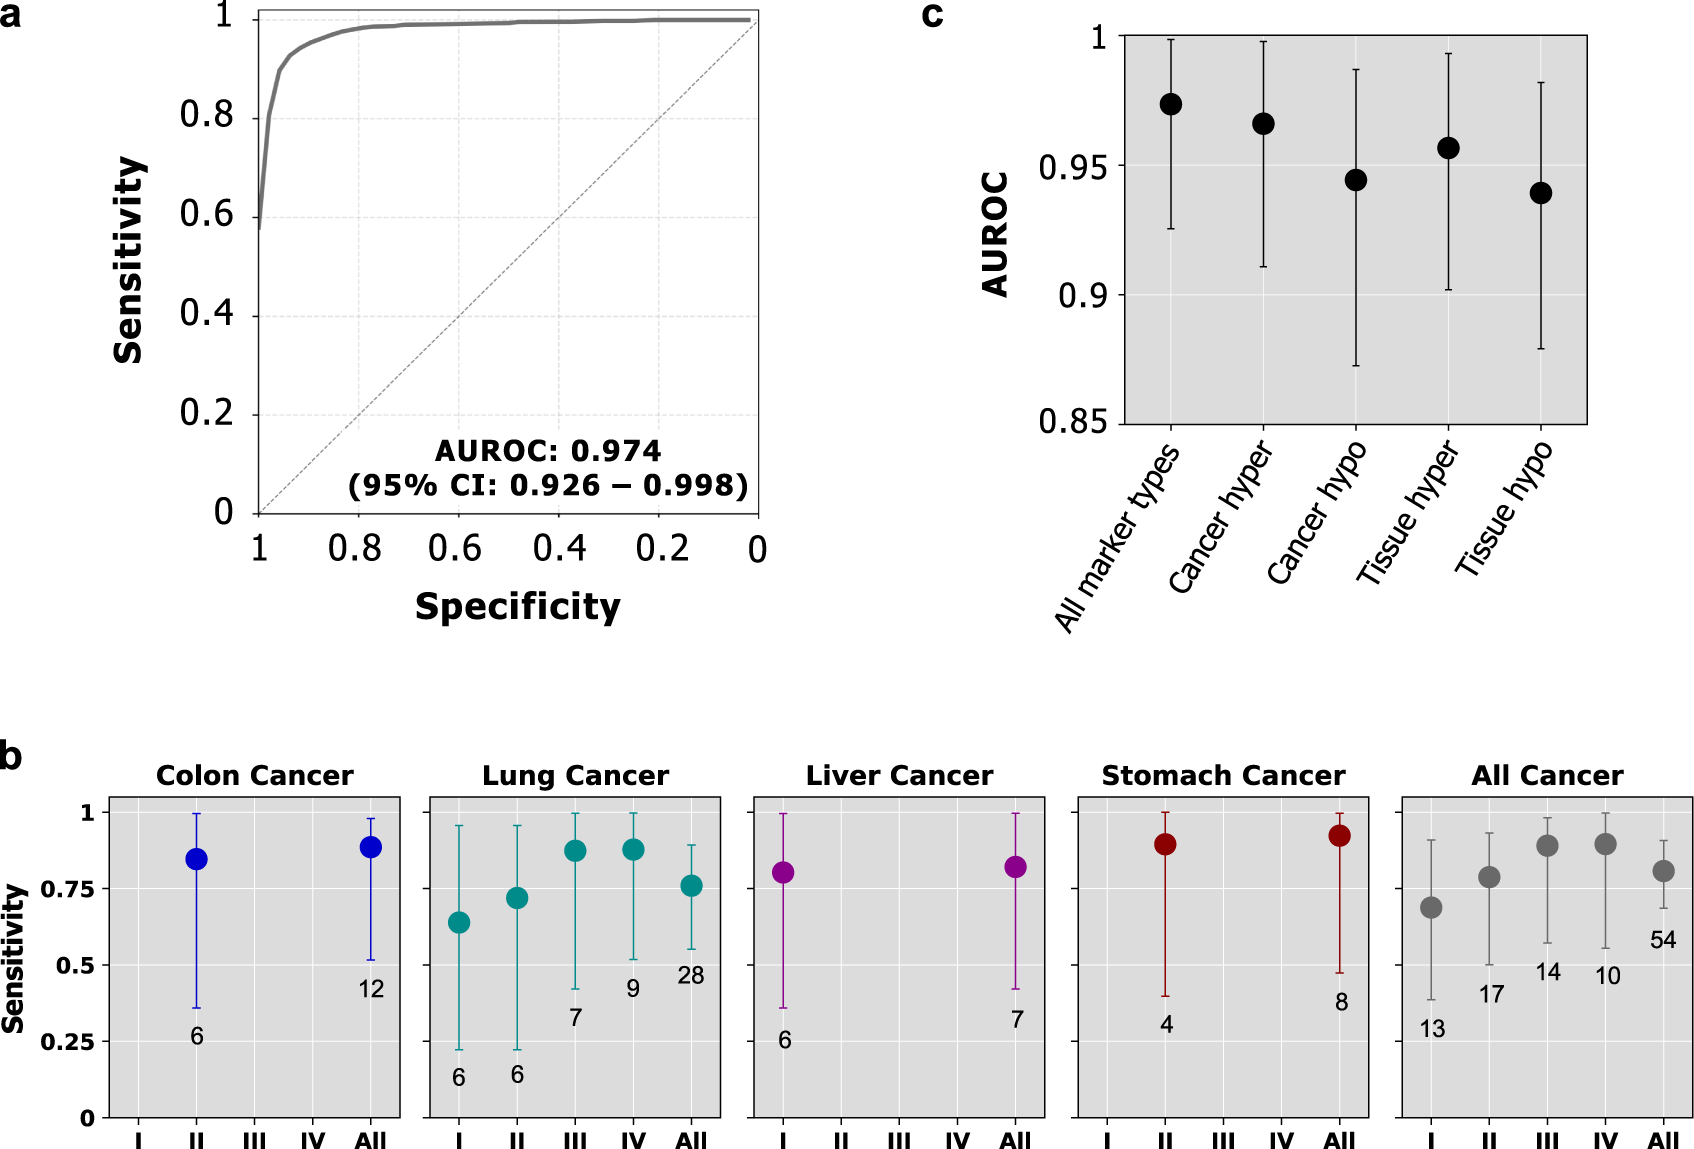
Figure 3 from Stackpole et al. 2022, Nature Communications, CC BY 4.0. Per-stage estimates rest on 4 to 17 test patients each, so the intervals in panel B are wide.
This is a developer result on one assembled cohort. Markers were discovered partly from plasma of the same cohort in each run, and specificity rests on one false positive among a few dozen test controls. A 2024 correction to the paper concerned the authors' competing-interest disclosure, not the performance values.
Deconvolution on real plasma
Sun and colleagues at Soochow University in Suzhou, with collaborators at UCLA, benchmarked five deconvolution methods in Genome Biology. They did not develop any of the five. They deconvolved each plasma sample against a 35-cell-type reference atlas, then trained a random forest on the estimated fractions to separate patients from healthy individuals.
On whole-genome bisulfite data from 24 liver cancer patients and 32 healthy individuals, AUROC was 0.96 for CelFEER, 0.93 for CelFiE, 0.91 for MethAtlas, 0.77 for cfNOMe and 0.72 for UXM. On cfMethyl-Seq data (30 to 67 patients per cancer type, each against the same 193 healthy individuals), values ranged from 0.72 for UXM in lung squamous cell carcinoma to 0.93 for CelFiE in gastric cancer. No method led for every cancer type.
Two design points limit these numbers. The paper does not state how the random forest was validated, so the AUCs may be in-sample. The forest also sees all 35 cell-type fractions, so it can separate groups on immune or other non-tumour shifts rather than on the affected tissue. The study answers whether deconvolved fractions carry a disease signal, not which method estimates tumour fraction best.
Limits of detection in simulated mixtures
Giuili, De Preter and colleagues in Ghent ran ten reference-based tools inside their DecoNFlow pipeline on in silico mixtures, in a bioRxiv preprint not yet peer reviewed. They mixed reads from tumour tissue or a neuroblastoma cell line into healthy plasma reads at known fractions and depths. The limit of detection was the lowest tested fraction whose ten replicates were still significantly above the 0% replicates.
| Tool | Method | WGBS tumour tissue | RRBS tumour tissue |
|---|---|---|---|
| CelFiE | Expectation maximisation | 0.0070 | 0.0100 |
| Houseman constrained projection (equality) | Least squares | 0.0100 | 0.0250 |
| meth_atlas | Non-negative least squares | 0.0250 | 0.0250 |
| MetDecode | Partly reference-based least squares | 0.0250 | 0.0250 |
| UXM | Fragment-level marker share | 0.0250 | 0.2500 |
| PRMeth | Matrix factorisation | 0.0500 | 0.0250 |
| EpiSCORE | Weighted partial correlation | 0.1000 | 0.1000 |
| EpiDISH RPC | Partial correlation | 0.2500 | 0.1000 |
| CIBERSORT | Support vector regression | 0.2500 | 0.1000 |
Giuili et al. 2025 (preprint), Supplementary Table 3, overall median across sequencing depths; tumour fraction, lower is better.
On the cell-line mixtures CelFiE reached 0.0010 and the Houseman projection 0.0030. For five tools the cell-line values in the supplementary table disagree with the paper's Figure 4A, so I do not report them. Limits improved with depth: CelFiE's median on whole-genome data was 0.0250 at 62 million aligned reads and 0.0070 at 620 million. The mixtures use tissue or cell-line DNA, not tumour cfDNA, and the medians pool tumour types.
Methylation against fragment features on the same reads
Yong Zeng, Housheng Hansen He, Trevor Pugh and colleagues at Princess Margaret Cancer Centre in Toronto, where cfMeDIP-seq was developed (Shen et al. 2018), compared a cfMeDIP-seq methylation classifier with fragment features of the same reads, in Nature Cancer. Each feature set was reduced to principal components and classified by the best of seven algorithms, chosen by nested cross-validation. The authors produced the cohorts and ran every classifier.
In cross-validation on 356 cancers and 64 healthy donors, methylation alone reached AUC 0.986 and detected 0.949 of cancers at 99% specificity. Fragment ratios reached 0.923 and 0.795. On an independent validation set, methylation alone detected 0.633 at 99% specificity, against 0.766 for methylation combined with fragment ratios and 0.533 for fragment ratios alone. The methylation-only validation AUC is printed differently in the text and the source data, so I leave it out.
The specificity is the weak point. Each cross-validation fold held six or seven healthy donors and the validation set 17, so a 99% threshold allows no false positive among them. Carriers of Li-Fraumeni syndrome without current cancer were counted as cancers in the validation sensitivities. Models that included end motifs collapsed in validation, which the authors attribute to healthy controls processed with a different laboratory protocol. The cancers were clinically diagnosed and many were advanced.
A methylation foundation model against elastic net
Yili Xu of the University of Southern California and Qianxi Feng of MicroTrace BioAI fine-tuned CpGPT on public targeted bisulfite cfDNA data, in a medRxiv preprint not yet peer reviewed. Neither developed CpGPT. The data were 254 gastrointestinal cancers and 46 non-cancer controls from the EpiPanGI Dx study. They built four classical classifiers on the same 20,499 DMR CpGs and the same three train, validation and test splits.
| Model | Test AUROC (95% CI) | Test AUPRC | Validation AUROC |
|---|---|---|---|
| CpGPT, fine-tuned | 0.9904 (0.9715 to 1.0000) | 0.9960 | 0.9487 |
| SVM, radial kernel | 0.9573 (0.8736 to 1.0000) | 0.9827 | 0.9367 |
| Elastic net | 0.9420 (0.8587 to 1.0000) | 0.9805 | 0.9300 |
| Gradient boosting | 0.8460 (0.7322 to 0.9602) | 0.9550 | 0.8767 |
| Random forest | 0.8408 (0.7573 to 0.9243) | 0.9475 | 0.7933 |
Xu and Feng 2026 (preprint), Table 3. Means and intervals are over three split-runs.
CpGPT had the highest point estimate on every measure. The test partitions held about 30 samples each, with few controls, and the intervals for CpGPT, the SVM and elastic net overlap. The candidate CpGs were selected with cancer labels from all 300 samples, including the test partitions, which the authors state. No sensitivity at a fixed specificity is reported. The authors call the comparison descriptive, and I agree.
Case-control numbers and the intended-use population
Where each study sits between an analytical test and a screening population. Diagram by the author.
Every patient study here is case-control. Cancers were diagnosed before enrolment, often after symptoms, and controls were chosen for contrast. In a screening population most cancers are early, tumour fractions are lower, and controls include people with inflammatory and other conditions that also change cfDNA. Since tumour fraction drives detection, sensitivity measured in diagnosed patients will be higher than in screening.
Stage-specific sensitivity is reported for only one detection study in printable form, cfMethyl-Seq's 74.5% for stage I and II, and its per-stage counts are small. CCGA substudy 1 shows stage effects only in figures. The other studies report no stage-stratified detection values.
Specificity matters as much as sensitivity at low prevalence. As an illustration with my own arithmetic and an assumed 1% prevalence: among 10,000 people, a test with CCGA's 34% sensitivity and 97.8% specificity would find 34 of 100 cancers and flag about 218 of 9,900 people without cancer. A threshold read on a handful of controls, as in Zeng et al. and Xu and Feng, cannot resolve specificity at this level.
What has not been measured
- No study reports sensitivity in an intended-use screening population with a threshold fixed in advance.
- No study compares assays (whole-genome bisulfite, enzymatic methyl-seq, targeted bisulfite, cfMeDIP-seq) with a detection endpoint on the same plasma samples.
- No independent study compares tissue-of-origin methods on patient plasma, and none measures origin calls in people without cancer.
- No study compares a trained tissue-of-origin classifier with reference-based deconvolution on the same samples.
- Deconvolution limits of detection come from simulated mixtures only; none is measured in patient dilution series.
- Only one foundation-model comparison exists, on about 30 test samples with features selected on the test set.
- No study reports specificity in people with non-cancer conditions that alter cfDNA, separately from healthy controls.
What would change the picture
Three studies would help most. The first is a same-sample comparison of at least two assays, for example targeted bisulfite and enzymatic methyl-seq, in a prospectively enrolled screening-age cohort, with sensitivity by stage at a locked specificity of 99% or higher. The second is an independent comparison of tissue-of-origin methods, including reference-based deconvolution and a trained classifier, on the same detected cancers. The third is a test of a methylation foundation model against elastic net with features selected on training data only, a held-out set of several hundred samples, and sensitivity at a fixed specificity.
Until then, methylation is the best-supported cfDNA feature for detection and origin, least-squares and probabilistic deconvolution remain the reference for tumour fraction, and no machine-learning method has shown a clear gain over them.
Per-method values and source details for every study above are in the Plasma ctDNA detection from methylation use case.
Help improve this article
Found an error or a better source? Leave a note here, or highlight a passage to comment on it.