Fragment-feature classifiers on low-pass plasma sequencing reach AUCs near 0.9 in case-control cohorts and, in one developer study, beat ichorCNA tumour fraction when ctDNA is scarce. No study has tested them in a screening population.
Evidence tables: every comparison in this review, with per-method values and source details, is on the plasma ctDNA fragmentomics use case in the Rewire benchmark database.
The question for a laboratory considering low-pass whole-genome sequencing (WGS) of plasma cell-free DNA (cfDNA) is which fragmentomic workflow detects tumour-derived DNA when the tumour fraction is low, at a specificity fixed in advance for the intended use. Sensitivity at 98% or 99% specificity matters more than AUC here, because a screening test runs at the far left of the ROC curve. The second question is whether a trained classifier adds anything to the copy-number estimate that a low-pass genome already gives.
This review covers eight peer-reviewed studies. Six use plasma WGS; two compute fragment features from other assays. All are retrospective case-control studies, and in every one the truth is a clinical cancer diagnosis against healthy or non-cancer controls. None uses tumour-informed ctDNA as the reference. I did not rerun any method, and cohorts, feature implementations and validation designs differ, so values from different studies cannot be pooled.
How fragment-based detection works
Most plasma cfDNA comes from dying blood cells, and its length reflects the DNA protected by one nucleosome. Tumour-derived fragments are on average shorter, end at different positions and with different end sequences, and come from chromatin with a different nucleosome layout. Each method family reads one of these traces from aligned reads.
Signals, method families and the reference standard used in every study below. Diagram by the author.
Fragment-size ratio methods. These count short and long fragments in genomic bins and compare the ratio profile with healthy plasma. DELFI (Cristiano et al. 2019) computes short-to-long ratios in 5 Mb bins and feeds them to a gradient-boosting classifier. Simpler variants use fragment length histograms, the standard deviation of length counts, or the Shannon entropy of fragment sizes in a region.
End-motif and nucleosome-footprint methods. End-motif methods count the 256 possible 4-mers at fragment 5' ends. Nucleosome methods use where fragments start and stop: the windowed protection score (WPS) compares fragments that span a 120 bp window with those that end inside it, orientation-aware fragmentation (OCF) compares upstream and downstream ends around open chromatin, and Griffin profiles coverage around transcription factor binding sites after GC correction. These signals are region-level and need many reads per region, which low-pass data spreads thin.
Copy number from low-pass WGS. ichorCNA (Adalsteinsson et al. 2017) bins read depth, corrects for GC and mappability against a panel of normals, and fits a hidden Markov model that returns copy-number segments and a tumour-fraction estimate. Its authors give 3% as the lower limit for detecting tumour from ultra-low-pass WGS, which is why two of the studies below use 3% as the low stratum boundary.
Classifiers on fragment features. Support vector machines, gradient boosting and XGBoost combine features from the first three families. UNITE (Wang et al. 2026) trains XGBoost on five features per 5 Mb bin (fragment length, the SD of length counts, the short/long ratio, a C/T end-motif ratio and copy number), and its CNN variant (ResNet18) reads a fragment-length by genome-bin matrix as an image. Its combined model therefore includes copy number.
Fragment language models. Fragmentia-AI tokenises sampled fragment sequences, encodes them with a DNABERT-2 transformer adapted with LoRA, and pools fragment embeddings into a sample score with attention-based multiple-instance learning. The model learns from the reads themselves rather than from predefined features. Two papers from Nanjing Geneseeq describe it. The first does not name the pretrained weights, if any, used to initialise the encoder, and no weights are public.
The baseline
The baseline is ichorCNA tumour-fraction estimation. It is the established algorithmic method for low-pass plasma WGS, it needs no trained classifier, and it is the only pre-machine-learning method compared with fragment classifiers on the same samples in a tumour-fraction-stratified design. The short/long ratio is a simpler fragment statistic, but in published work it feeds a trained classifier, so I treat it as a feature rather than a baseline.
The baseline is not the truth. The reference standard in every study is clinical diagnosis. ichorCNA also defines the tumour-fraction strata in UNITE and Fragmentia-AI WGS, which creates a bias: cancers in the strata above 3% were placed there because ichorCNA saw tumour, and cancers below 3% because it did not. Comparisons within strata therefore favour ichorCNA above 3% and penalise it below. A measured tumour fraction from a tumour-informed assay would remove this circularity; no study used one.
| Method | Type | Baseline | Result against the baseline on the same data | Study |
|---|---|---|---|---|
| ichorCNA tumour fraction | Hidden Markov model on read depth | Yes | AUC 0.642 overall; 0.603 at 3% or less; 0.983 at 3% to 10% | Wang et al. 2026 |
| XGBoost, five features including copy number | Machine learning | No | AUC 0.916 overall, 0.878 at 3% or less, 0.962 at 3% to 10% | Wang et al. 2026 (developer) |
| XGBoost, fragment length only | Machine learning | No | AUC 0.902, 0.873, 0.896 | Wang et al. 2026 (developer) |
| XGBoost, short/long ratio only | Machine learning | No | AUC 0.740, 0.651, 0.772 | Wang et al. 2026 (developer) |
| DELFI | Gradient boosting on ratios | No | No same-data comparison with ichorCNA in printed tables | None |
| GRAIL fragment length classifier, 30x WGS | Machine learning | No | 29% sensitivity at 98% specificity against 27% for GRAIL's own copy-number classifier (not ichorCNA); built after unblinding | Jamshidi et al. 2022 (developer) |
| Fragmentia-AI | Fragment language model | No | No comparison with ichorCNA; AUC 0.9561 against 0.9209 to 0.935 for DELFI features | Fragmentia-AI 2026 (developer) |
Wang values are cross-validation means from Data file S2 (all strata, at most 3%, and over 3% up to 10% ichorCNA tumour fraction). The ichorCNA comparator is a classifier on the ichorCNA estimate built by the UNITE authors.
So machine learning beats the baseline where the baseline is blind by construction, below its own detection limit, in one developer cross-validation. Between 3% and 10%, the baseline wins. No independent group has repeated the comparison, and no foundation model has been run against ichorCNA on the same samples.
| Family (tools) | Accuracy | Reproducibility | Compute | Ease of use | Interpretability |
|---|---|---|---|---|---|
| Fragment-size ratio (short/long ratio, DELFI) | DELFI 73% at 98% specificity (developer cross-validation); short/long alone AUC 0.651 at 3% or less (UNITE) | Depends on pre-analytical handling, which changes fragment sizes | Low; counts per bin | Simple to compute from a BAM file | Ratio profile per bin can be plotted |
| End-motif and nucleosome footprint (EDM, WPS, OCF, Griffin) | End motif AUC 0.9736 in cross-validation, 0.5355 and 0.5508 on independent lung cohorts (Hou) | Sensitive to pre-analytical batch: motif classifiers fell below AUC 0.5 when controls were processed differently (Zeng) | Moderate; thousands of regions per sample | Open implementations exist | Region-level, linked to chromatin state |
| Copy number (ichorCNA), the baseline | AUC 0.983 and 0.796 sensitivity at 95% specificity at 3% to 10%; 0.058 at 3% or less (UNITE) | Deterministic given a panel of normals | Low; CPU | Widely used, open source | Returns a tumour fraction and a copy-number profile |
| Classifiers on fragment features (SVM, XGBoost, CNN) | AUC 0.916 overall, 0.878 at 3% or less (UNITE cross-validation) | Depends on the training cohort; rankings changed on new cohorts (Hou) | Low to moderate | Needs a labelled training cohort | Feature importance only |
| Fragment language model (Fragmentia-AI) | AUC 0.9561 held-out; 0.930 overall and 0.910 below 3% on an independent test cohort | Not reproducible outside the developer: code and data on request, no public weights | GPU; transformer over sampled fragments | Not available as software | Attention over fragments; prioritised fragments are enriched for short lengths |
Ten fragmentation patterns on one cohort
Yuying Hou, Xiang-Yu Meng and Xionghui Zhou at Huazhong Agricultural University re-implemented ten published fragmentation patterns and DELFI, each with one support vector machine, in Advanced Science in 2024. They developed none of the patterns except IFS, which Zhou developed earlier. The main cohort is the DELFI cohort of 208 cancers in seven types and 215 healthy individuals.
In 10 x 10-fold cross-validation, pan-cancer AUC with features from open chromatin regions ranged from 0.8741 for fragment length to 0.9736 for the 5' end motif. WPS reached 0.9658, IFS 0.9653, fragment end counts 0.9639, coverage 0.9638, fragment size ratio 0.9441 and fragment size distribution 0.9271. Their DELFI re-implementation reached 0.9575.
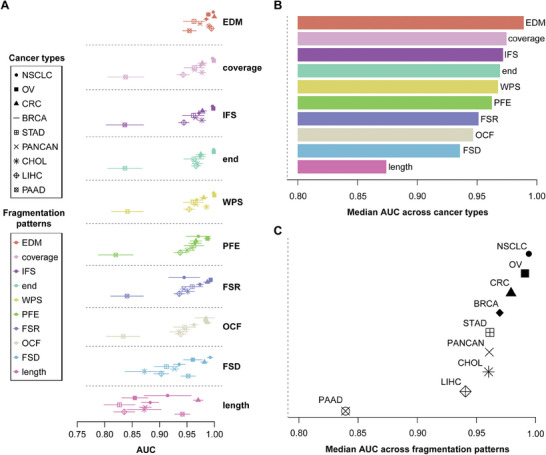
Figure 2 from Hou et al. 2024, Advanced Science, CC BY 4.0. Cross-validated AUC for ten fragmentation patterns by cancer type (A), median across cancer types (B) and median across patterns (C).
These AUCs are high and close together, and the cohort explains part of that: clinically identified cancers against healthy individuals. Hou et al.'s supplementary sensitivities at 95% specificity for the pan-cancer and liver blocks conflict with other tables in the same file, so I do not quote them.
Rankings change on independent cohorts
The same lung-cancer models, trained on only 12 lung cancers and the 215 healthy controls, were applied to two public cohorts from Mathios et al. The first has 46 lung cancers and 385 healthy individuals. The second, LUCAS, has 129 lung cancers against 91 healthy individuals and 67 people with benign findings, which is closer to a diagnostic population.
| Pattern | Cross-validation AUC (DELFI cohort) | Independent cohort: AUC, sensitivity at 95% specificity | LUCAS: AUC, sensitivity at 95% specificity |
|---|---|---|---|
| End motif | 0.9736 | 0.5355, 0.0652 | 0.5508, 0.0775 |
| Fragment size distribution | 0.9271 | 0.9386, 0.7174 | 0.5457, 0.1008 |
| Fragment length | 0.8741 | 0.8669, 0.4783 | 0.6636, 0.2016 |
| WPS | 0.9658 | 0.8562, 0.5000 | 0.7505, 0.2713 |
| Fragment end count | 0.9639 | 0.8297, 0.5217 | 0.7327, 0.2791 |
| Coverage | 0.9638 | 0.8397, 0.4565 | 0.7305, 0.2713 |
Hou et al. 2024, Table 1 (pan-cancer, open chromatin regions) and Supporting Information Table S3 (lung models). Cross-validation is pan-cancer; the independent columns are lung-specific models.
The pattern with the highest cross-validated AUC, the end motif, fell to near chance on both new cohorts. Fragment size distribution was best on one new cohort and near chance on the other. With benign lung disease among the controls, no pattern exceeded AUC 0.7505 or detected more than 28% of cancers at 95% specificity. Twelve training cancers is a small base, but the instability is the finding: a feature ranking from one case-control cohort did not transfer.
Fragment features against ichorCNA by tumour fraction
Haichao Wang, Nitzan Rosenfeld and colleagues at the Cancer Research UK Cambridge Institute and Barts Cancer Institute built UNITE, published in Science Advances in 2026. They pooled new and public 0.1x WGS to 1,690 samples (458 healthy, 1,232 cancers of 26 types) and cross-validated on 1,237 of them. The pool includes samples from the DELFI cohort and the liver cohort used by Hou et al. Three authors are inventors on pending patent applications for the method.
They stratified cancers by ichorCNA tumour fraction and trained each feature set separately within each stratum, with the same healthy controls in every stratum.
| Model | 3% or less | Over 3% to 10% | Over 10% | All |
|---|---|---|---|---|
| XGBoost, all five features | 0.878 | 0.962 | 0.998 | 0.916 |
| Fragment length | 0.873 | 0.896 | 0.972 | 0.902 |
| SD of length counts | 0.857 | 0.881 | 0.970 | 0.888 |
| Copy number (XGBoost on bins) | 0.736 | 0.926 | 0.998 | 0.817 |
| C/T end-motif ratio | 0.715 | 0.740 | 0.849 | 0.744 |
| Short/long ratio | 0.651 | 0.772 | 0.917 | 0.740 |
| ichorCNA tumour fraction (baseline) | 0.603 | 0.983 | 1.000 | 0.642 |
Mean cross-validated AUC, 5-fold repeated 10 times, from Wang et al. 2026 Data file S2. The 3% or less stratum has 536 cancers and 325 healthy controls in cross-validation.
At 95% specificity, the ichorCNA classifier detected 0.058 of cancers at 3% or less, 0.796 at 3% to 10% and 0.374 overall. At 99% specificity the values were 0.004, 0.561 and 0.279. The fragment models' fixed-specificity values are in a sheet whose lowest-stratum columns print identical sensitivity at 98% and 99% specificity for every feature set, so I do not quote them.
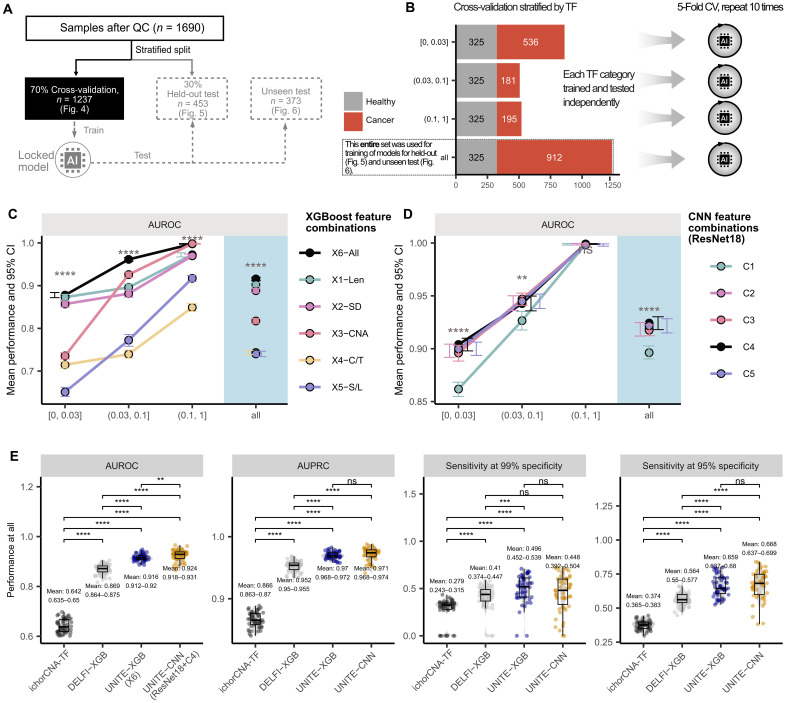
Figure 4 from Wang et al. 2026, Science Advances, CC BY 4.0. Cross-validated AUROC by ichorCNA stratum for XGBoost (C) and CNN (D) feature sets, and unstratified comparison with ichorCNA-TF and a DELFI re-implementation (E).
Three points follow. Fragment length carries most of the low-fraction signal: alone it reached 0.873 against 0.878 for all five features. The short/long ratio, the core DELFI feature, was the weakest fragment feature at low fraction. And copy number as XGBoost features (0.736) did better than the single ichorCNA estimate (0.603) at 3% or less, which suggests sub-threshold copy-number signal that the HMM's tumour-fraction call discards. Panel E shows the DELFI re-implementation between the ichorCNA classifier and UNITE without stratification.
The stratification caveat from the baseline section applies in full. The circularity is visible in the over-10% column, where the ichorCNA classifier is perfect because ichorCNA chose those samples.
A fragment language model against re-implemented baselines
Xu and colleagues at Nanjing Geneseeq compared Fragmentia-AI with six fragmentomic feature sets on 0.1x WGS in Cell Reports Medicine in 2026. The cohort has 2,004 cancers of 17 types and 1,245 non-cancer controls. They re-implemented each baseline and trained it with random forest, XGBoost and a deep-learning classifier.
| Features | Random forest | XGBoost | Deep learning |
|---|---|---|---|
| Fragmentia-AI (fragment language model) | 0.9561 | ||
| DELFI | 0.9209 | 0.935 | 0.9319 |
| Griffin | 0.881 | 0.8863 | 0.8846 |
| FRAGMA | 0.8375 | 0.8489 | 0.8533 |
| FDI | 0.8473 | 0.8441 | 0.8514 |
| Nucleosome | 0.7932 | 0.8006 | 0.8103 |
| Subnucleosome | 0.674 | 0.6756 | 0.6364 |
Held-out AUC from Table S5 of the Fragmentia-AI paper. The held-out set size is not stated.
The gap to the best DELFI configuration is 0.021 AUC. The paper does not give the held-out set size, does not name the test behind its p-values, and calls the same quantity 0.956 and 0.97 in one paragraph. It also gives no sensitivity at fixed specificity for this comparison. The developers built every arm. Among the re-implemented baselines, DELFI features beat every nucleosome-based feature set under every classifier; in Hou et al.'s cross-validation, by contrast, WPS, coverage and end counts scored above DELFI.
The largest tumour-fraction-stratified test
The same company's whole-genome model was evaluated in Molecular Biomedicine in 2026. It was trained at about 0.1x on 2,450 cancers and 1,245 non-cancer controls, selected on a validation set of 894 cancers and 1,149 controls, and tested once on an independent cohort of 2,952 cancers and 3,044 controls sequenced at about 0.05x. The cutoff was fixed at 98% specificity in training and carried unchanged to the test cohort. The training controls equal the Cell Reports Medicine cohort's control count, so the two studies may share samples.
On the test cohort, AUC was 0.930 overall, 0.984 above 5% ichorCNA tumour fraction, 0.958 at 3% to 5%, and 0.910 below 3%. At the transferred cutoff, specificity was 0.97 and sensitivity 0.58 overall, and 0.91, 0.72 and 0.46 from the highest to the lowest stratum. Among the 2,115 low-fraction cancers, it detected 0.391 at stage I or II (637 of 1,628) and 0.708 at stage III or IV (345 of 487).
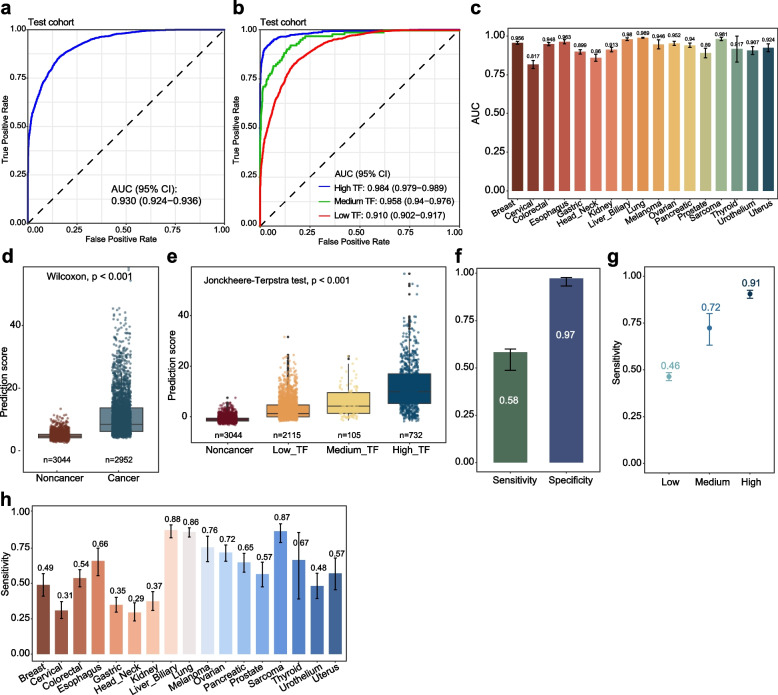
Figure 4 from Xu et al. 2026, Molecular Biomedicine, CC BY 4.0. Independent test cohort: ROC overall (a) and by ichorCNA tumour fraction (b), and sensitivity at the training-derived cutoff overall (f), by stratum (g) and by cancer type (h).
This is the closest any study comes to the endpoint a laboratory needs: sensitivity within low tumour-fraction strata at a threshold fixed before testing, on a large held-out cohort. It still lacks a comparator, since no other method was run on these samples, and the strata are ichorCNA estimates. The validation set shows why training data matter: a version fine-tuned only on high-fraction samples reached AUC 0.652 below 3%, against 0.884 for the final model trained across all strata. On the public DELFI cohort, from another sequencing platform, AUC was 0.929 but specificity at the transferred cutoff fell to 0.92, with sensitivity 0.78.
Fragment classifiers beside copy number and methylation at 30x
Arash Jamshidi and colleagues at GRAIL compared prototype classifiers on the same participants of the Circulating Cell-free Genome Atlas substudy 1 in Cancer Cell in 2022. Plasma was sequenced at 30x, not low pass, and every threshold was set at 98% specificity within each set.
| Classifier | Training, cross-validation (833 cancers, 560 non-cancers) | Validation (464 cancers, 362 non-cancers) |
|---|---|---|
| Fragment lengths | 28% (25% to 32%) | 29% (25% to 34%) |
| Fragment endpoints | 22% (19% to 25%) | 18% (15% to 22%) |
| Copy number | 33% (29% to 36%) | 27% (23% to 31%) |
| Copy number, white-cell corrected | 33% (30% to 37%) | 30% (26% to 34%) |
| Whole-genome methylation | 39% (36% to 43%) | 34% (30% to 39%) |
Jamshidi et al. 2022, Table 3. Sensitivity with 95% CI at 98% specificity.
The fragment classifiers were developed after the validation set was unblinded, so their validation values are not a blinded result, while the copy-number and methylation classifiers were analysed double-blinded. At 30x, fragment length matched copy number and fell short of methylation. No tumour-fraction-stratified sensitivity is printed.
Fragment features from other assays
Two studies compute fragment features without low-pass WGS. Zeng and colleagues, who developed cfMeDIP-seq, derived fragment features from methylation-enriched reads in Nature Cancer in 2026. On an independent validation set, a fragment-ratio classifier reached AUC 0.848 and detected 0.533 of cancers at 99% specificity. With 17 healthy controls, 99% specificity allows no false positive. Three of the five classifiers that include end motifs scored below AUC 0.5 on validation, which the authors attribute to controls processed with a different laboratory protocol. End motifs are the feature most exposed to pre-analytical batch.
Kyle Helzer and colleagues at the University of Wisconsin adapted twelve fragmentomic metrics and Griffin to targeted exon panels in Nature Communications in 2025. In 404 metastatic cancers and 27 healthy donors, healthy-versus-cancer AUROC ranged from 0.835 (open-chromatin entropy) to 0.989 (first-exon depth), with Griffin at 0.944. These are metastatic patients, so the comparison says little about early detection.
Who measured what
| Study | Data and truth | Methods | Relationship to methods | Status |
|---|---|---|---|---|
| Cristiano et al. 2019 | DELFI cohort: 208 cancers, 215 healthy; clinical diagnosis | DELFI | Developers | Peer reviewed |
| Hou et al. 2024 | DELFI, liver and three independent public cohorts | Ten patterns and DELFI, one SVM each | Independent except IFS | Peer reviewed; two supplementary blocks inconsistent |
| Wang et al. 2026 | 1,690 pooled 0.1x samples; ichorCNA strata | UNITE, single features, ichorCNA classifier | Developers of UNITE; patents pending | Peer reviewed |
| Fragmentia-AI 2026 | 2,004 cancers, 1,245 controls, 0.1x | Fragmentia-AI and six re-implemented feature sets | Developers; re-implemented every baseline | Peer reviewed |
| Fragmentia-AI WGS 2026 | Test: 2,952 cancers, 3,044 controls; ichorCNA strata | Fragmentia-AI only | Developers | Peer reviewed |
| Jamshidi et al. 2022 | CCGA substudy 1, 30x WGS | Fragment, copy-number, methylation and variant classifiers | Developers (GRAIL) | Peer reviewed |
| Zeng et al. 2026 | cfMeDIP-seq; 17 validation controls | Methylation and fragment features of the same reads | Developers of the assay | Peer reviewed |
| Helzer et al. 2025 | Targeted panels; metastatic cancers | Twelve metrics, their combination and Griffin | Independent except their entropy metrics | Peer reviewed |
Where each study sits by validation design. Diagram by the author.
What has not been measured
- No fragmentomic method has been evaluated in a screening or symptomatic population with a prespecified threshold. Every value above comes from clinically diagnosed cancers against selected controls.
- No study uses tumour-informed ctDNA or a measured tumour fraction as truth. Low-fraction strata are ichorCNA estimates, which ties the strata to the baseline.
- No independent group has compared fragment classifiers with ichorCNA on the same samples. The one comparison is a developer cross-validation.
- No independent dilution series or limit-of-detection comparison of Griffin, LIQUORICE, FinaleToolkit and DELFI has been published with per-tool values in tables.
- Specificity in inflammatory, autoimmune or vascular disease has no tabulated comparison. These conditions raise cfDNA and could shift fragment profiles.
- No fragment language model has been tested by a group other than its developer, or against ichorCNA.
- Several cohorts overlap. The DELFI samples recur in Hou et al., UNITE and the Fragmentia-AI WGS external check, so agreement across these studies is not independent replication.
What this means for a laboratory
On current evidence, fragment length is the feature to start with at low pass. It carried most of UNITE's low-fraction signal, held up better than end motifs on independent cohorts, and is computed from the same BAM file without new assays. End-motif features scored highest in one cross-validation and failed on new cohorts and across a pre-analytical change, so I would not rely on them without matched controls processed in the same laboratory.
I would run ichorCNA alongside any fragment classifier, not replace it. Above about 3% tumour fraction it matched or beat the classifiers, and it returns an interpretable copy-number profile. A local validation should report sensitivity at the intended specificity, stratified by stage and by tumour fraction measured from a tumour-informed assay where tissue is available, and should include non-cancer controls with inflammatory disease and benign lesions.
What would change the picture
Three studies would help most. The first is an independent comparison of ichorCNA, DELFI, single fragment features and a foundation model on the same low-pass samples, with tumour fraction measured by a tumour-informed assay rather than by ichorCNA. The second is a dilution series of tumour into healthy plasma that gives each tool's limit of detection at fixed specificity. The third is a prospective study in an intended-use population, such as people referred with symptoms or lung nodules, with the threshold fixed before unblinding.
Until then, fragment classifiers add sensitivity below ichorCNA's detection limit in developer studies, ichorCNA remains as good or better above it, and no fragmentomic workflow has a measured screening performance.
Per-method values and source details for every study above are in the plasma ctDNA fragmentomics use case.
Help improve this article
Found an error or a better source? Leave a note here, or highlight a passage to comment on it.