Eight published comparisons of somatic SNV and indel callers do not name one best workflow. Rankings change from study to study, the best indel F1 is lower than the best SNV F1 in every study that scores both, and none covers FFPE tissue, ctDNA or targeted panels. Against the conventional baseline, Mutect2, the deep-learning callers matched it in independent tumour-normal tests and beat it clearly only in developer-run tumour-only tests.
Evidence tables: every comparison in this review, with per-tool values and source details, is on the Tumour DNA somatic variant detection use case in the Rewire benchmark database.
The practical question is which calling or rescoring workflow detects tumour SNVs and small indels reliably from tumour and matched-normal sequencing, for a given sequencing design, tumour purity, coverage and variant allele fraction (VAF). The answer depends on which variants are reported: VAF range, genomic context, and whether indels matter as much as SNVs. The studies below report precision, recall and F1 against a truth set. They measure caller accuracy, not the clinical classification of variants.
Three of the eight sources are recent: a tumour-normal benchmark on the Genome in a Bottle HG008 pair, developer papers for the tumour-only callers ClairS-TO and VarNet-T, and a synthetic whole-exome (WES) test.
How the caller families work
Every caller in these studies takes aligned reads from a tumour and, in most designs, a matched normal sample from the same person. Each writes a VCF of somatic SNVs and small indels. The families differ in how they find candidate sites, how they decide whether a candidate is somatic, germline or noise, and what they need to run.
Where each family sits in a tumour-normal workflow. In tumour-only mode the normal is absent and filtering relies on panels of normals and population databases.
Statistical and Bayesian callers
Mutect2, Strelka2, VarScan 2 and Lancet compute a likelihood or test statistic from the read evidence at each candidate site. Mutect2 reassembles reads locally into haplotypes, then applies probabilistic models for genotyping and filtering that its developers describe as working with and without a matched normal (Benjamin et al. 2019). Strelka2 uses a tiered haplotype model, estimates indel error rates from each sample with a mixture model, and models tumour contamination of the normal (Kim et al. 2018). That last model fits the SEQC2 result below, where Strelka2 lost little F1 when the normal held 5% tumour DNA. VarScan 2 reads tumour and normal together and classifies each variant as germline, somatic or loss of heterozygosity with a heuristic and statistical algorithm (Koboldt et al. 2012). Lancet builds a colored de Bruijn graph of tumour and normal k-mers in each window, so a somatic indel appears as a path present only in the tumour (Narzisi et al. 2018).
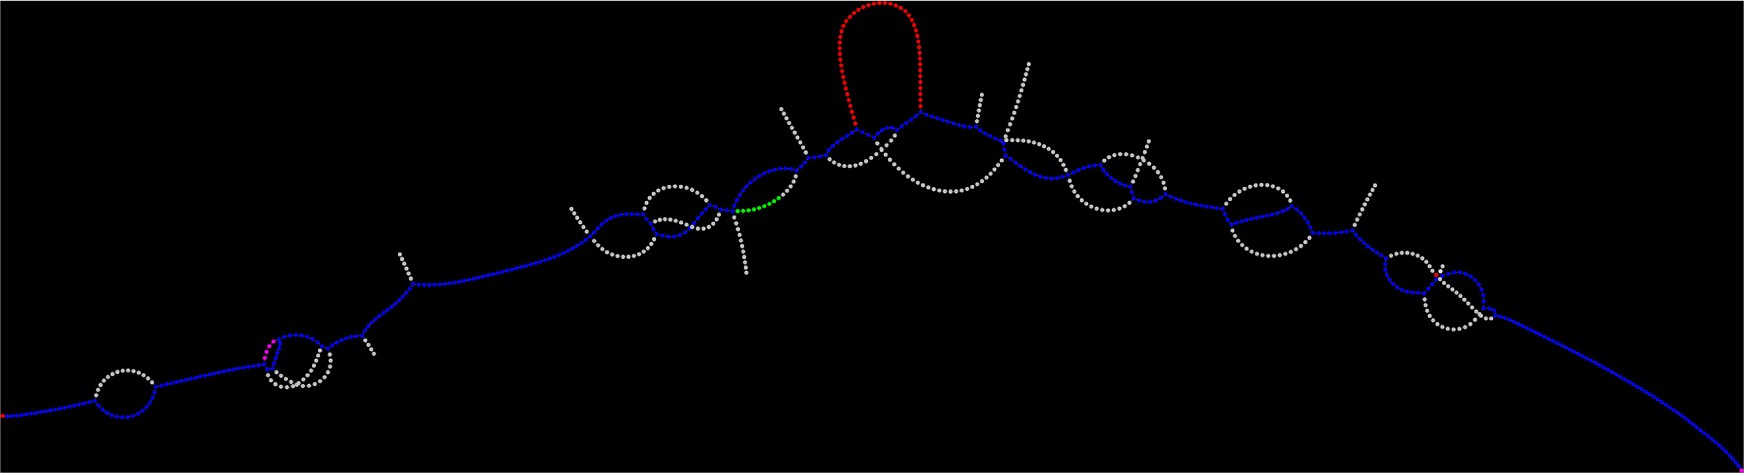
Figure 1 from Narzisi et al. 2018, Communications Biology, CC BY 4.0. The red loop is the tumour-only path that marks the insertion.
These tools are open source and run on CPUs. Each call can be traced to read counts, base and mapping qualities, and named filters in the VCF. Results depend on configuration: the panel of normals, the germline resource and the filter thresholds. Compute cost varies widely. The Lancet developers report about 3,000 core hours and at least 20 GB of RAM for one 80x/40x whole-genome pair (Narzisi et al. 2018). In Guille and colleagues' exome benchmark, CPU time across 20 callers ranged from 7 min 38 s (TNScope) to 4 h 24 min (Lancet), with a mean of 1 h 24 min (Guille et al. 2025).
DRAGEN
DRAGEN is a licensed Illumina product. Its somatic mode uses localized haplotype assembly and a Bayesian posterior probability that a somatic variant is present, then filters position-specific noise with a file built from a panel of normals (DRAGEN v4.4 somatic mode documentation). Field-programmable gate array (FPGA) hardware accelerates alignment and variant calling (Behera et al. 2025). That paper reports about 30 minutes from raw reads to variants, but for germline genomes. I found no primary source for somatic runtime. In tumour-only mode, the documentation states that DRAGEN does not attempt to separate germline from somatic variants and can tag variants common in gnomAD as germline.
Deep-learning callers
These callers encode the reads around each candidate as a tensor and pass it to a neural network trained on labelled variants. NeuSomatic summarises tumour and normal alignments as base-frequency matrices with k channels of size 5 × 32 and classifies them with a convolutional network of nine convolutional layers. It runs alone or takes other callers' outputs as extra channels (Sahraeian et al. 2019). DeepSomatic extends DeepVariant and builds pileup image tensors from tumour and normal reads (DeepSomatic repository). It has models for Illumina WGS and WES, PacBio, Oxford Nanopore, FFPE and tumour-only data (Park et al. 2025). VarNet was trained with weak supervision: pseudo-labels from high-confidence calls of four callers on more than 300 tumour genomes from seven cancer types (Krishnamachari et al. 2022). VarNet-T applies the same approach to tumour reads alone. ClairS-TO pairs an affirmative network, which estimates how likely a candidate is somatic, with a negational network, which estimates how likely it is not. It combines the two into a posterior and then filters with panels of normals (Chen et al. 2025).
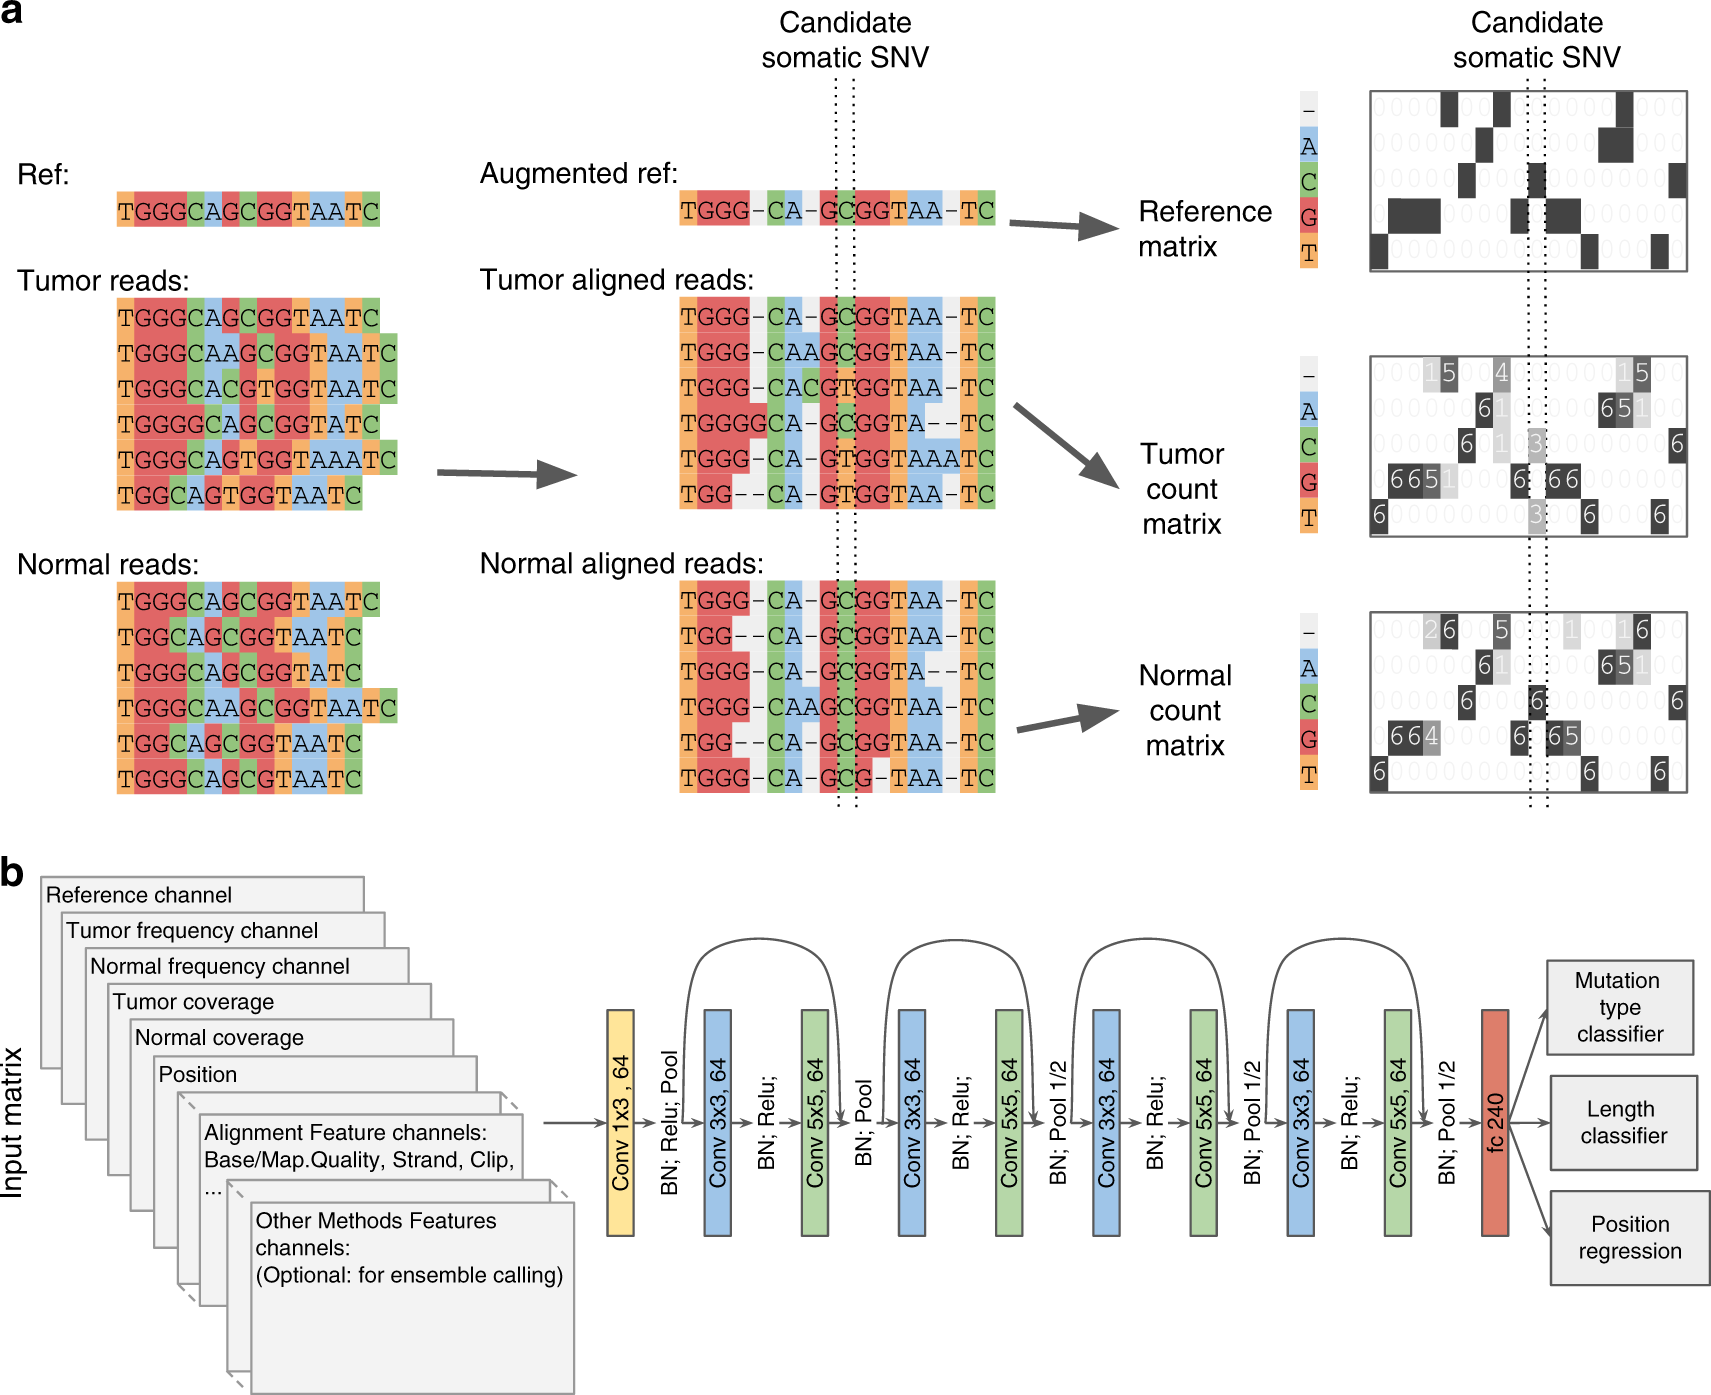
Figure 1 from Sahraeian et al. 2019, Nature Communications, CC BY 4.0.
Accuracy depends on how close the test data is to the training data. Several studies below had to set aside models trained on HCC1395 when scoring on HCC1395. Results are tied to a model file as well as a software version, so both need recording. Compute ranges from CPU-only to GPU. The NeuSomatic developers report about 156 CPU core-hours for a 30x tumour-normal genome in stand-alone mode, and about 8 h on eight Tesla K80 GPUs to train a whole-genome model. The DeepSomatic documentation reports about 4 h 54 min wall time for an Illumina WGS tumour-normal pair on a 96-vCPU, 384 GiB machine with no GPU, and about 2 h 40 min for tumour-only WGS (DeepSomatic r1.8 metrics). Each call comes with a score from the network rather than a stated rule. The VarNet authors used guided backpropagation to show which input pixels drove its calls, an analysis done after training. Licences differ: NeuSomatic's code is released under CC BY-NC-SA 4.0, and DeepSomatic under BSD-3-Clause, with a statement that it is not intended for clinical use. All of these are task-specific classifiers trained on somatic labels. None is a pretrained genomic foundation model.
Ensembles and consensus
Ensembles run several callers and vote. SomaticCombiner writes the union of all callers' variants to one VCF, records each caller's decision and the tumour VAF, and applies majority voting or a VAF-adaptive vote (Wang et al. 2020). A reviewer can see which callers agreed on each call. The cost is running and maintaining every member caller, and the vote threshold is tuned on data. In Guille and colleagues' exome benchmark the best SNV combination used six tools and 10 h 17 min of total CPU time. A three-tool vote (MuSE, Mutect2 and Strelka, two agreeing) reached a similar F1 in 3 h 1 min (Guille et al. 2025).
Tumour-normal and tumour-only modes
Tumour-only is a mode, not a family. Mutect2, DRAGEN, DeepSomatic and ClairS-TO all offer it. Without a matched normal, germline variants must be removed using population databases and panels of normals. The tumour-only evidence below comes from two developer papers.
| Family | Accuracy in these studies | Reproducibility | Compute | Ease of use | Interpretability |
|---|---|---|---|---|---|
| Statistical or Bayesian (Mutect2, Strelka2, VarScan 2, Lancet) | Best single SNV F1 in the independent exome test (Mutect, 0.85); Mutect2 led indels on HG008 (0.82) | Deterministic given version, resources and thresholds; sensitive to panel of normals and filter choices | CPU only; from minutes to about 3,000 core hours (Lancet WGS) | Open source; run as defaults in pipelines such as nf-core/sarek | High: read counts, qualities and named filters per call |
| DRAGEN | Highest mean SNV F1 (92.3%) in the SEQC2 replicate comparison | Versioned commercial releases; noise file from a panel of normals | FPGA hardware acceleration; no published somatic runtime found | Commercial licence; one integrated pipeline | Moderate: posterior and filter flags in the VCF |
| Deep learning (NeuSomatic, DeepSomatic, VarNet, ClairS-TO, VarNet-T) | Near the top on HG008 SNVs (DeepSomatic 98.4%); tumour-only results only from developer papers | Fixed weights per release; accuracy depends on overlap between training and test data | CPU or GPU; 156 core-hours (NeuSomatic) to 4 h 54 min on 96 vCPUs (DeepSomatic WGS) | Containers and pretrained models; licences range from BSD-3-Clause to non-commercial | Low: a network score; post hoc saliency maps only |
| Ensemble or consensus (majority vote, SomaticCombiner) | Highest SNV F1 on seven of eight WGS pairs (Wang et al.); highest overall F1 on HG008 (0.91) | Depends on every member caller's version and on the vote rule | Sum of member callers; 3 to 10 h CPU for exome ensembles | Several tools to install and maintain | High: which callers agreed is recorded per call |
Accuracy cells repeat values from the studies below. Compute values come from the primary sources cited in this section and were measured on different data and hardware.
The baseline
The baseline in this review is Mutect2, the GATK somatic caller. It reassembles reads into local haplotypes, scores each candidate with probabilistic models of the tumour and normal reads, and then filters with a panel of normals and a population germline resource (Benjamin et al. 2019). It contains no trained network. It is the only caller scored in all eight studies, it is the comparator in every deep-learning paper cited here, and it is the stronger of the two common statistical callers in most of them. Strelka2 beat it on SNVs only in the SEQC2 replicate comparison (89.0% against 85.8% mean F1), and fell well below it on HG008, the independent exome test and the synthetic exome.
The baseline is not the truth. Each study scores callers against its own truth set: simulated or inserted variants, the SEQC2 consensus call set for HCC1395, or the draft Genome in a Bottle HG008 benchmark. A clinical laboratory would use orthogonal confirmation, such as a second assay, as its reference standard. The baseline is the conventional method a newer caller has to beat on the same data and the same truth.
Two other families in this review are also algorithmic, not machine learning. Ensembles vote over statistical callers, Mutect2 included. DRAGEN's default somatic mode uses a Bayesian posterior and a hidden Markov model, with noise estimated from the data at runtime (DRAGEN v4.4 somatic mode documentation). DRAGEN v4.5 adds an optional machine-learning recalibration step for tumour-normal calling, labelled beta and switched on with a flag (DRAGEN v4.5 Somatic ML). The SEQC2 comparison below used DRAGEN v3.7.5, before that option existed (Sahraeian et al. 2022).
Each machine-learning caller against Mutect2, within the same study:
- NeuSomatic, independent test. In Wang et al. 2020, NeuSomatic in ensemble mode with its DREAM3 model had higher SNV F1 than MuTect2 (GATK 3.7) on three of eight WGS pairs: DREAM 4 (0.859 against 0.825), AML (0.799 against 0.268) and MB (0.558 against 0.452). It was lower on the other five, including CLL (0.24 against 0.52) and DREAM 3, the set its model was trained on (0.848 against 0.889) (Supplementary Table S1 of Wang et al. 2020).
- NeuSomatic, developer test. Over the 21 SEQC2 WGS replicates, NeuSomatic in ensemble mode with the DREAM3 model reached 91.8% mean SNV F1 and 79.3% indel F1, against 85.8% and 73.7% for MuTect2. Ensemble mode takes MuTect2 and Strelka2 calls as input features. Stand-alone NeuSomatic with the same model reached 86.3% and 67.7%: 0.5 points above MuTect2 on SNVs and 6 points below it on indels (Additional file 2, Table S2 of Sahraeian et al. 2022). DRAGEN, which is not machine learning, was highest at 92.3%.
- DeepSomatic, independent preprint. On HG008, overall F1 in the primary region was 0.897 for DeepSomatic and 0.898 for Mutect2. DeepSomatic was higher on SNVs (98.4% against 94.5%) and lower on indels (0.69 against 0.82). Over the whole draft benchmark it was 0.78 against 0.79 (Hasan 2026).
- VarNet, independent test. On the SEQC2 exome test replicate, VarNet had SNV F1 0.84 and indel F1 0.66, against 0.83 and 0.65 for Mutect2 (Supplementary Table S7 of Guille et al. 2025). The first-generation Mutect reached 0.85. The DeepSomatic and NeuSomatic models in that study were trained with HCC1395 data, so their scores there are not a fair comparison.
- ClairS-TO, developer test, tumour-only. SNV F1 0.77 against 0.58 for Mutect2 in tumour-only mode on Illumina COLO829, with each threshold chosen on the test data (Chen et al. 2025). DeepSomatic's tumour-only model reached 0.62 in the same test.
- VarNet-T, developer test, tumour-only. SNV AUPRC 0.77 on SEQC2 and 0.66 on COLO829, against 0.08 and 0.07 for Mutect2 (Krishnamachari et al. 2026). ClairS-TO scored 0.54 and 0.27 in the same paper.
- Octopus-RF, which filters calls with a random forest, was trained on HCC1395 in the SEQC2 study and is excluded for the reason given there.
- No genomic foundation model has been compared with Mutect2 on any of these data sets.
| Method | Family | Baseline | Result against Mutect2 in the same study | Study and who measured |
|---|---|---|---|---|
| Mutect2 | Statistical | Baseline | Not applicable | All eight studies |
| Strelka2 | Statistical | No | Higher SNV F1 on SEQC2 WGS (89.0% vs 85.8%); lower on HG008 (0.78 vs 0.90) and exome (Strelka 2.9.2, 0.64 vs 0.83) | Sahraeian 2022, developers of NeuSomatic; Hasan 2026 and Guille 2025, independent |
| DRAGEN (v3.7.5) | Bayesian, hardware-accelerated | No | Higher: SNV 92.3% vs 85.8%, indel 81.7% vs 73.7% | Sahraeian 2022, developers of NeuSomatic |
| Majority vote | Ensemble, algorithmic | No | Higher: 0.91 vs 0.90 on HG008; 0.88 vs 0.83 SNV on exome | Hasan 2026; Guille 2025; both independent |
| NeuSomatic, ensemble mode | Deep learning | No | Higher on 3 of 8 WGS pairs, lower on 5; higher on SEQC2 WGS (91.8% vs 85.8%) | Wang 2020, independent; Sahraeian 2022, developers |
| NeuSomatic, stand-alone | Deep learning | No | Slightly higher on SNVs (86.3% vs 85.8%), lower on indels (67.7% vs 73.7%) | Sahraeian 2022, developers |
| DeepSomatic | Deep learning | No | Level overall (0.897 vs 0.898); higher SNV, lower indel | Hasan 2026, independent preprint |
| VarNet | Deep learning | No | Level: SNV 0.84 vs 0.83, indel 0.66 vs 0.65 | Guille 2025, independent |
| ClairS-TO (tumour-only) | Deep learning | No | Higher: SNV F1 0.77 vs 0.58 | Chen 2025, developers |
| VarNet-T (tumour-only) | Deep learning | No | Higher: SNV AUPRC 0.77 vs 0.08 on SEQC2 | Krishnamachari 2026, developers |
| Genomic foundation model | Foundation model | No | Never compared | None |
Values from the main text of each paper or from the supplementary tables named above. Mutect2 versions differ between studies: GATK 3.7 in Wang et al., 4.beta.6 in Sahraeian et al., 4.2.2.0 in Guille et al.
In tumour-normal calling, no machine-learning caller has beaten Mutect2 clearly in an independent test. DeepSomatic and VarNet matched it, and NeuSomatic beat it in fewer than half the pairs in Wang et al. The clear wins are in developer-run tumour-only tests, where Mutect2 without a matched normal is a weak comparator. Most of the highest tumour-normal scores came from majority-vote ensembles and DRAGEN, which are both algorithmic.
The comparisons side by side
Each study used its own truth set, sequencing and scoring, so values should be compared within a row, not across rows.
| Study | Who measured | Data and truth set | Headline result |
|---|---|---|---|
| Narzisi et al. 2018 (Lancet) | Lancet developers | Real-read virtual tumour, WGS | SNV F1 0.85 for both Lancet and Strelka2; indel F1 0.81 and 0.77 |
| Wang et al. 2020 | Authors of the ensembles; did not develop the callers | 4 simulated DREAM pairs, CLL, AML and MB tumours, COLO829, WGS | Best single configuration SNV F1 0.92 to 0.96 on DREAM 1 to 3, 0.70 to 0.81 on real tumours |
| Sahraeian et al. 2022 | NeuSomatic developers | SEQC2 HCC1395 WGS, 21 replicate pairs, held-out half of genome | Mean SNV F1 92.3% DRAGEN, 91.8% NeuSomatic (DREAM3 model), 89.0% Strelka2 |
| Guille et al. 2025 | Independent of the callers | SEQC2 HCC1395 WES, 1,160 truth SNVs, 50 truth indels | Best single SNV F1 0.85 (Mutect); ensembles 0.88 |
| Hasan 2026 (preprint) | Single author, independent of the callers | GIAB HG008 tumour-normal, 14,014 truth variants in primary region | F1 0.91 majority vote, 0.90 Mutect2 and DeepSomatic, 0.78 Strelka2 |
| López-Cade et al. 2025 | Independent clinical group | Synthetic WES pair, 4,709 inserted SNVs | SNV recall 0.63 Mutect2, 0.46 Strelka2 |
| Chen et al. 2025 (ClairS-TO) | ClairS-TO developers; tumour-only | Illumina COLO829, 50x | SNV F1 0.77 ClairS-TO, 0.62 DeepSomatic, 0.58 Mutect2 |
| Krishnamachari et al. 2026 (VarNet-T) | VarNet-T developers; tumour-only | SEQC2 and COLO829 Illumina WGS | SNV AUPRC 0.77 VarNet-T, 0.54 ClairS-TO, 0.08 Mutect2 on SEQC2 |
Values are from the primary papers listed in the references, as printed or rounded; percentages are kept where the source prints them.
Synthetic and cell-line results overstate accuracy on real tumours
Wang and colleagues at the Frederick National Laboratory for Cancer Research ran eight callers, NeuSomatic and their own majority-vote ensembles on eight whole-genome tumour-normal pairs (Wang et al. 2020). An ensemble had the highest SNV F1 on seven of the eight. On DREAM set 4, NeuSomatic was highest at 0.86, but its model was trained on DREAM set 3 from the same simulator.
The gap between simulated and real data is the main result. The best single configuration reached SNV F1 0.92 to 0.96 on DREAM sets 1 to 3, and 0.70 to 0.81 on the CLL, AML and MB tumours. On those tumours most callers had precision below 0.6. The curated truth sets for those tumours may be incomplete, so precision there is a lower bound. The caller versions were older, for example MuTect2 from GATK 3.7.
Indels were worse. On the CLL and MB tumours and the COLO829 cell line, indel F1 was at most 0.72 for every configuration. AML had no indel truth set.
The SEQC2 cell line gives replicate depth but one genome
The NeuSomatic developers, Sahraeian and colleagues at Roche Sequencing Solutions, scored callers on SEQC2 HCC1395 whole-genome data, in the half of the genome held out from their model training (Sahraeian et al. 2022). The design covers 21 replicate pairs from six centres, 47 purity and coverage mixtures, and six library preparations. Their SEQC2-trained NeuSomatic models and Octopus-RF were trained on the same cell line, or may have been, so their scores on it are not a fair test and are left out here.
Over the 21 replicates, mean SNV F1 was 92.3% for DRAGEN, 91.8% for NeuSomatic with its DREAM3 model and 89.0% for Strelka2. Indel F1 was 81.7%, 79.3% and 72.8%. Two co-authors hold a patent application on NeuSomatic, so its rows are developer-reported.
The mixtures matter more for laboratory design than the replicate means. Across purities from 5% to 100% and coverage from 10x to 300x, mean SNV F1 was at most 67.7% (Octopus with hard filters). When the 80x normal sample was contaminated with 5% tumour DNA, SNV F1 for a pure tumour fell from 88.6% to 43.8% for MuTect2 and from 93.3% to 47.8% for Lancet. Strelka2 fell only from 92.4% to 90.9%.
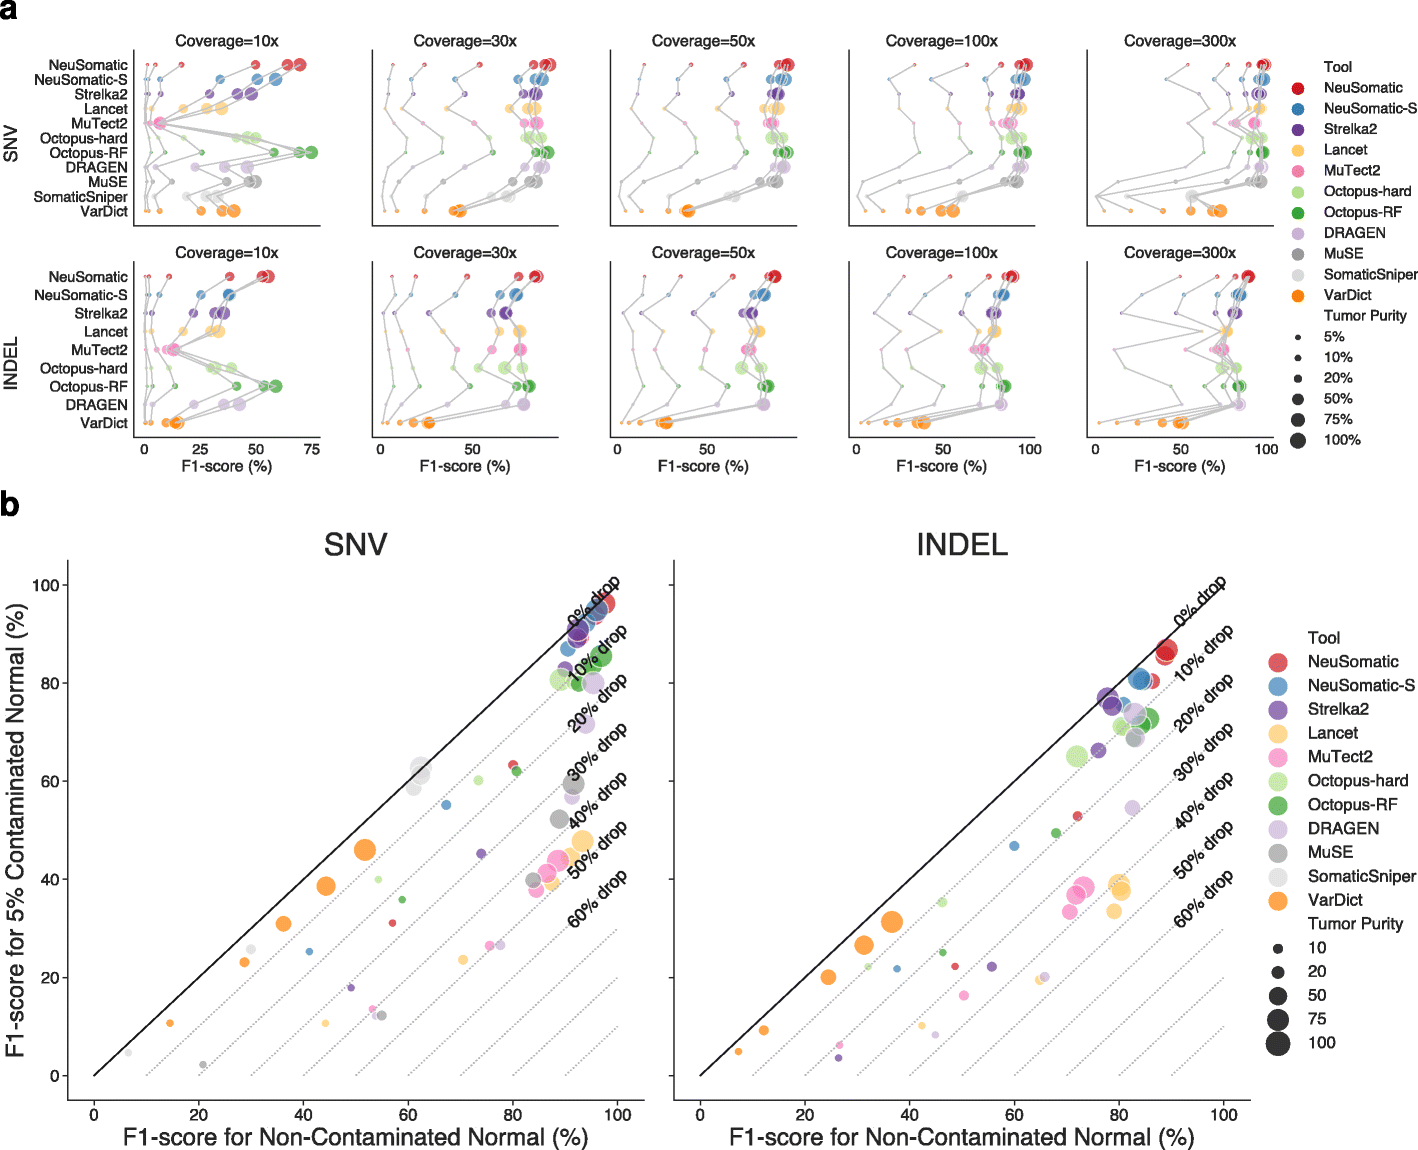
Figure 4 from Sahraeian et al. 2022, Genome Biology, CC BY 4.0. NeuSomatic rows use SEQC2-trained models, which were excluded from the comparison in the text.
DNA input showed a similar pattern. DRAGEN's SNV F1 was 92.6% for the 100 ng Nextera library and 30.5% for the 1 ng TruSeq-Nano library, which had about 7x effective coverage after duplicate removal. These tables print only F1, with no precision, recall or uncertainty.
An independent exome test changes the order
Arnaud Guille and colleagues at Institut Paoli-Calmettes in Marseille, who did not develop the callers, scored them on a WES replicate of HCC1395 (Guille et al. 2025). The truth set held 1,160 SNVs and 50 indels. Another replicate with the same truth set was used to choose their ensembles, so the test is not fully independent of development.
Leaving out DeepSomatic and NeuSomatic, whose pre-trained models were built with HCC1395 data, the best single caller reached SNV F1 0.85 (Mutect) and indel F1 0.66 (VarNet). The authors' ensembles reached 0.88 for SNVs and 0.75 and 0.74 for indels. With only 50 truth indels, one variant moves recall by 0.02.
Strelka reached SNV F1 0.64 here, with precision 0.51. Strelka2 reached 0.85 in the Lancet developers' virtual-tumour test (Narzisi et al. 2018). That contrast shows how much a result depends on the study design.
HG008 adds a newer tumour-normal pair, with caveats
The newest tumour-normal comparison uses the Genome in a Bottle HG008 pair (Hasan 2026). It is a single-author preprint, not peer reviewed, run under the author's company, AmbioSpire LLC. The author developed none of the callers but defined the three ensembles. The truth set is the draft HG008-T v0.3, limited to clonal and truncal variants, and the original scoring code was not retained.
In the primary region (14,014 truth variants, excluding sites with germline interference), F1 was 0.91 for a two-of-three majority vote, 0.90 for Mutect2 and DeepSomatic, and 0.78 for Strelka2. For SNVs alone, the majority vote reached 98.5% and DeepSomatic 98.4%. Strelka2's SNV recall was 0.980 but its precision was 0.694, with 3,927 false positives. For indels, Mutect2 reached 0.82 and DeepSomatic and Strelka2 0.69.
Over the whole draft benchmark (18,207 truth variants), F1 was 0.70 to 0.79 for all six workflows. In the germline-interference stratum, DeepSomatic F1 was 0.0528. The preprint does not state whether DeepSomatic's bundled model was trained with HG008 data. It is the only study here with interval estimates: 95% block-bootstrap intervals on F1, which describe variation across the genome of one sample, not between tumours.
Tumour-only and synthetic results answer the question only in part
Two developer papers test tumour-only calling, without a matched normal. Their results say little about tumour-normal workflows, and both come from the developers of the winning caller.
On Illumina COLO829 at 50x, the ClairS-TO developers report SNV F1 0.77 for ClairS-TO against 0.62 for DeepSomatic, 0.58 for Mutect2, 0.40 for Octopus and 0.22 for Pisces (Chen et al. 2025). Indel F1 was at most 0.29. Each F1 is at the threshold that gave that caller its best F1 on the test data. Truth variants with fewer than three supporting reads or VAF below 0.05 were not scored. The senior author receives research funding from Oxford Nanopore Technologies.
The VarNet-T developers report SNV AUPRC (area under the precision-recall curve) of 0.77 on SEQC2 and 0.66 on COLO829 (Krishnamachari et al. 2026). ClairS-TO scored 0.54 and 0.27, and Mutect2 0.08 and 0.07. On three low-burden tumours every tumour-only caller had AUPRC at most 0.11.
The two papers used different COLO829 sequencing data and truth sets. The same ClairS-TO model (Illumina SSRS, v0.4.0) had COLO829 SNV AUPRC 0.65 in its developers' paper and 0.27 in the VarNet-T paper. That spread is larger than most of the differences between callers.
López-Cade and colleagues, a clinical group that did not develop the callers, ran Mutect2 and Strelka2 with default nf-core/sarek 3.5.0 settings on a synthetic WES pair (López-Cade et al. 2025). Mutect2 recalled 0.63 of 4,709 inserted SNVs and Strelka2 0.46. Inserted variants carry no tumour artefacts, so precision near 1 is expected by construction and says little.
What has not been measured
- None of the results summarised here covers FFPE tissue, ctDNA or targeted panels. One amplicon-panel preprint prints per-variant detection but no per-caller metric.
- Tumour-only calling rests on two developer papers. I found no independent tumour-only comparison with per-caller values published between October 2025 and October 2026.
- Only the HG008 preprint reports interval estimates, and only for F1.
- Caller versions differ between studies, and no study evaluates current releases of every caller.
- No study evaluates a caller built on a genomic foundation model.
This review also leaves out some relevant work: the SEQC2 consortium's own whole-genome comparison (Xiao et al. 2021), the WES, AmpliSeq, FFPE and runtime results in Sahraeian et al. 2022, the peer-reviewed DeepSomatic paper, and long-read tumour-normal calling with ClairS.
What would change the picture
I would give most weight to an independent comparison on a real clinical tumour cohort with a pinned truth set, current caller releases, and results split by purity, VAF, platform and genomic context. FFPE, panel and ctDNA data would extend the evidence to the assays most diagnostic labs run. Interval estimates for precision and recall, not only F1, would show which differences between callers are larger than sampling noise.
Until then, the published studies support a narrower reading. On clean tumour-normal data, several callers and simple majority-vote ensembles reach similar SNV F1. Indels, low purity, low DNA input, a contaminated normal and germline-adjacent sites are where they separate. Those are the conditions a lab's own validation set should test, with results reported by VAF and context rather than as one overall F1.
The per-tool values behind each comparison are in the Tumour DNA somatic variant detection use case.
References
- Narzisi et al. 2018, Genome-wide somatic variant calling using localized colored de Bruijn graphs, Communications Biology.
- Wang et al. 2020, SomaticCombiner: improving the performance of somatic variant calling based on evaluation tests and a consensus approach, Scientific Reports.
- Sahraeian et al. 2022, Achieving robust somatic mutation detection with deep learning models derived from reference data sets of a cancer sample, Genome Biology.
- Guille et al. 2025, A benchmarking study of individual somatic variant callers and voting-based ensembles for whole-exome sequencing, Briefings in Bioinformatics.
- Hasan 2026, Prospectively frozen external benchmarking reveals benchmark-context dependence in somatic variant calling, Research Square preprint.
- López-Cade et al. 2025, Comparative Evaluation of Mutect2, Strelka2, and FreeBayes for Somatic SNV Detection in Synthetic and Clinical Whole-Exome Sequencing Data, Biomolecules.
- Chen et al. 2025, ClairS-TO: a deep-learning method for long-read tumor-only somatic small variant calling, Nature Communications.
- Krishnamachari et al. 2026, Improved tumor-only variant calling and mutation burden estimation with VarNet-T, Nature Communications.
- Koboldt et al. 2012, VarScan 2: somatic mutation and copy number alteration discovery in cancer by exome sequencing, Genome Research.
- Kim et al. 2018, Strelka2: fast and accurate calling of germline and somatic variants, Nature Methods.
- Benjamin et al. 2019, Calling somatic SNVs and indels with Mutect2, bioRxiv preprint.
- Sahraeian et al. 2019, Deep convolutional neural networks for accurate somatic mutation detection, Nature Communications.
- Krishnamachari et al. 2022, Accurate somatic variant detection using weakly supervised deep learning, Nature Communications.
- Behera et al. 2025, Comprehensive genome analysis and variant detection at scale using DRAGEN, Nature Biotechnology.
- Park et al. 2025, Accurate somatic small variant discovery for multiple sequencing technologies with DeepSomatic, Nature Biotechnology.
- Illumina, DRAGEN v4.4 somatic mode documentation.
- Illumina, DRAGEN v4.5 Somatic ML for small variant calling (beta).
- Google, DeepSomatic repository and r1.8 runtime metrics.
Help improve this article
Found an error or a better source? Leave a note here, or highlight a passage to comment on it.