The pitch for genomic foundation models is that one pretrained network can replace a shelf of specialist tools. The evidence is more interesting. Evo 2 led the tested models on BRCA1 noncoding single-nucleotide variants without task-specific training,1 while the final AlphaGenome paper reports that it matched or exceeded the strongest external model on 25 of 26 variant-effect evaluations.2 Yet five foundation models and two other deep networks failed to beat simple linear baselines in any perturbation-response setting tested.3 Those results live in the same field. Sometimes scale buys a new capability; sometimes it buys an expensive way to rediscover the mean.
It helps to keep two ledgers while reading this literature. A capability ledger records what the models can demonstrably do at scale, and a validity ledger records what holds up when you pass each claim through an independent test set with an honest baseline. The marketing reports the first ledger; a molecular pathology lab has to act on the second. So the organizing question here is not "which model is best." It is: when you subtract leaderboard theatre and force every claim through a held-out test set with a baseline the model has to beat, what is left standing?
Three families make the field easier to navigate: sequence models that read DNA or protein, structure models that predict biomolecular shape, and single-cell models that learn from expression profiles. Since my January 2026 guide, longer-context sequence models and all-atom structure models have arrived, while independent benchmarks have made the weak spots harder to hide. This piece is organized around that evidence, not the vendors. The aim is a comparison a molecular pathologist can forward to a colleague because it is fair to each model and explicit about what remains unknown.
Why an honest comparison is hard, before any results
The single most important 2026 result for this audience is not a model. It is GENEB, a benchmark that evaluated frozen representations from 40 genomic foundation models across 100 tasks in 13 functional categories under one probing protocol.4 Its aggregate leaderboards are unstable: rankings vary sharply by task, scale brings modest and inconsistent gains, and architecture or pretraining alignment frequently matters more than parameter count.4 GENEB's authors also report no financial conflicts and say none of the evaluated models was built by them or their funders.4 That reduces an obvious source of bias, although it cannot prove that every incentive is absent.
If you do not address the field's known traps up front, an expert reader assumes you do not know about them. There are five that matter for clinical genomics.
Tokenization is not neutral. DNA models disagree on what a token is. HyenaDNA and Evo operate at single-nucleotide resolution; DNABERT-2 learns a vocabulary of recurring sequence fragments.567 DNABERT-2's authors show that overlapping k-mers can reveal masked-token content through adjacent tokens.7 That is a demonstrated pretraining shortcut, not proof that every downstream score is inflated. The broader point survives: two models reporting the same accuracy may be solving slightly different problems at different resolutions.
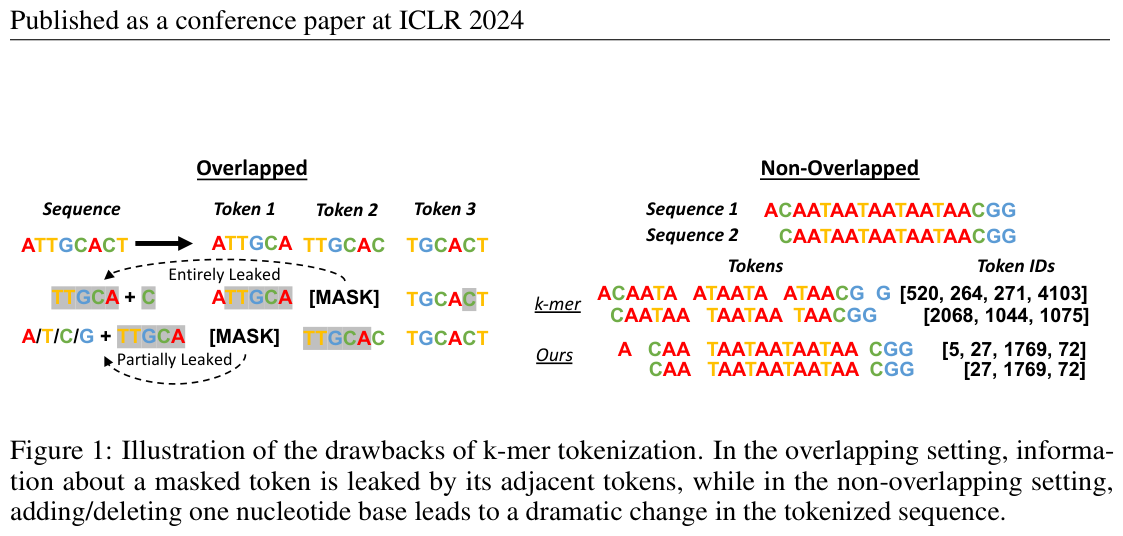 Figure 1: Illustration of k-mer tokenization drawbacks (information leakage in the overlapping setting) that motivated Byte Pair Encoding in DNABERT-2. Source: DNABERT-2 (Zhou et al., ICLR 2024)
Context length is asymmetric and consequential. Early Transformer DNA models were limited to 512 to 4,000 tokens, less than 0.001 percent of the human genome, which structurally prevented them from modeling long-range interactions.5 That matters clinically because nucleic acids up to one million base pairs from a gene can have significant regulatory effects.8 A model with a 4 kb window and a model with a 1 Mb window are not competing on a level field for an enhancer-promoter question. Comparing them without saying so is misleading, and many published comparisons do exactly that.
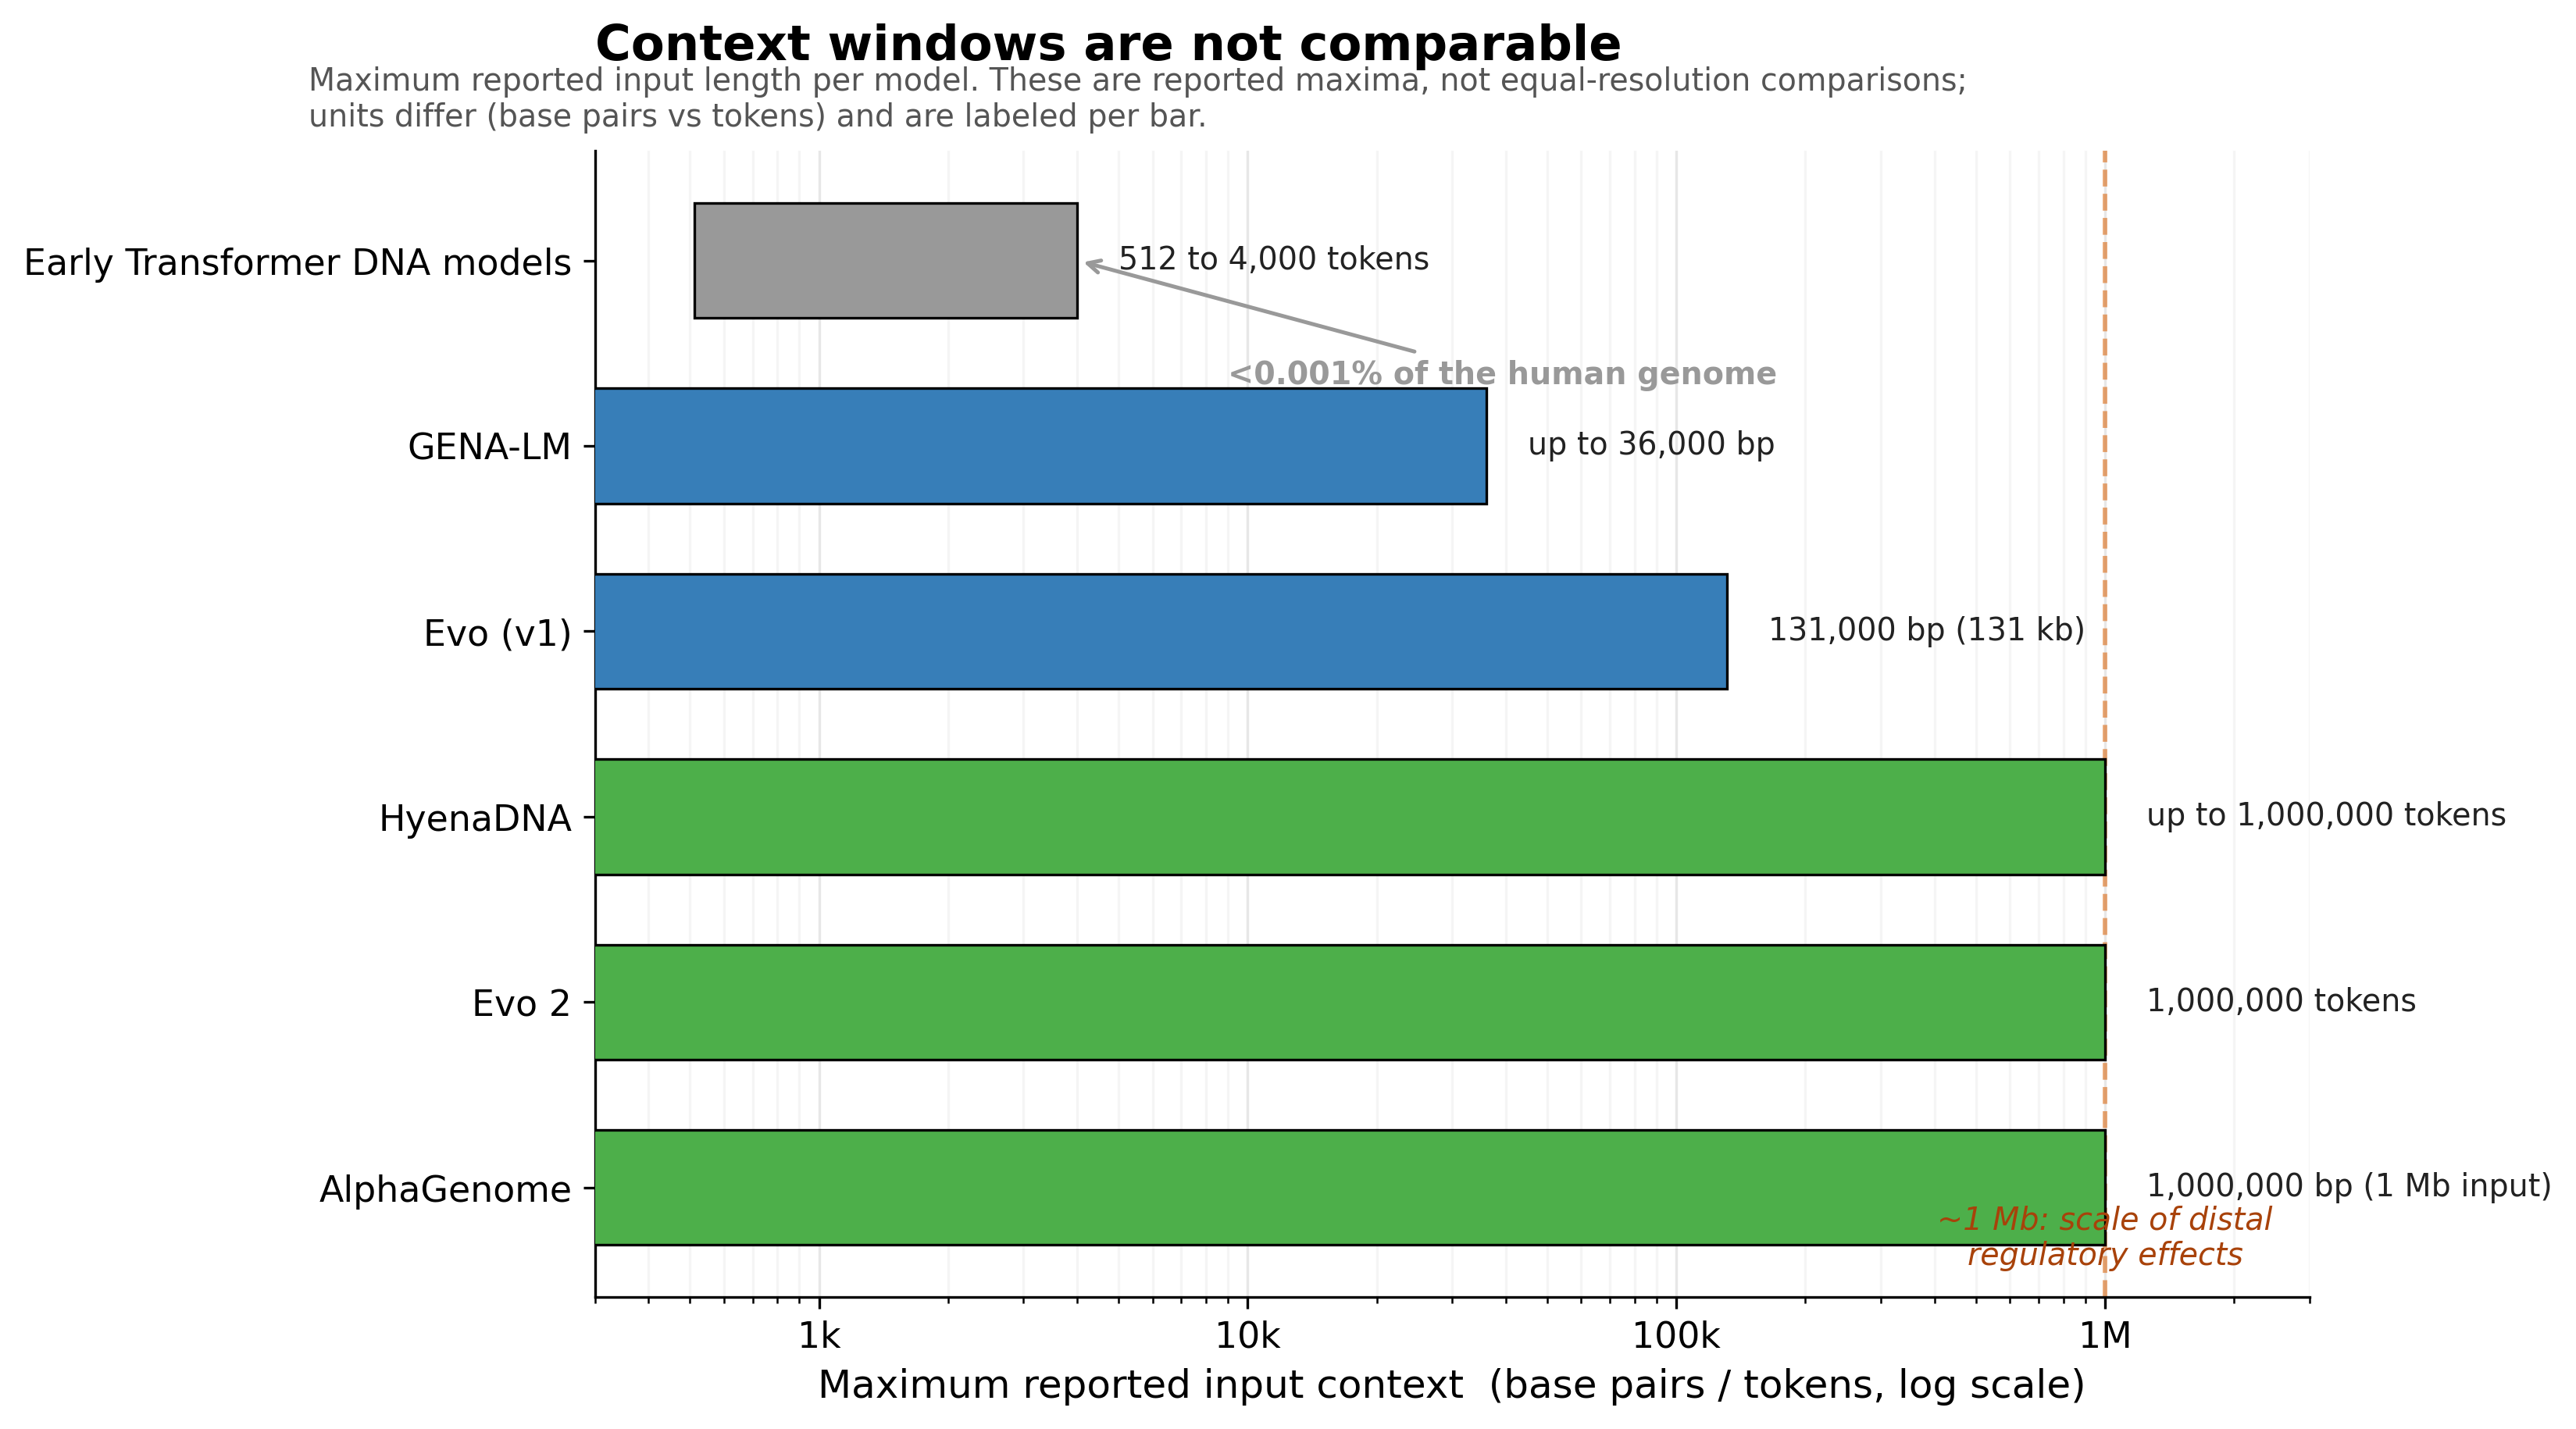 Figure 2: Reported maximum context windows across genomic models, log scale. These are reported maxima, not equal-resolution comparisons, and units differ across models (tokens versus base pairs). Sources: HyenaDNA5, Evo6, Evo 21, AlphaGenome2, GENA-LM4.
Contamination is a risk ledger, not a blanket verdict. Reference-sequence exposure, label leakage, and distribution shift are different failure modes. They need different tests.
| Example | Pretraining exposure | Held-out unit and label | What is demonstrated | What remains unresolved |
|---|---|---|---|---|
| AlphaGenome | Human and mouse reference genomes plus functional tracks | Fold-split models evaluated on held-out genomic regions; measured functional outcomes for several variant tasks2 | Regional hold-outs reduce direct location leakage | Generalization across ancestries, laboratories, and prospective cases |
| Evo 2 BRCA1 | A large cross-species sequence corpus | Saturation-mutagenesis labels for BRCA1 noncoding variants1 | Zero-shot discrimination against experimental labels | Whether reference exposure or related sequences influence the score |
| scGPT / Geneformer | Large public single-cell atlases | Zero-shot clustering and integration datasets9 | Pretraining exposure did not guarantee a win over simple baselines | Performance after task-specific finetuning on other endpoints |
A high retrospective AUROC measures discrimination on its stated split. Calling it “memorization” requires evidence of the leakage path; calling it clinical utility requires a prospective study. Neither inference comes free.
Benchmarks are fragmented and unstable. The DNABERT-2 authors identified the absence of a standardized benchmark as a significant impediment to fair comparison and built the GUE suite (36 datasets, 9 tasks, input lengths from 70 to 10,000 bp) in response.7 BEND made the same diagnosis for long-range tasks: evaluation tasks differ between works and often fail to recapitulate the length, scale, and sparsity of real genome annotation.10 OmniGenBench reaches the same conclusion about inconsistent metrics across studies.11 GENEB's task-group heatmap is the clearest single picture of the problem: rankings reshuffle as you move across functional categories, with no model dominant everywhere.
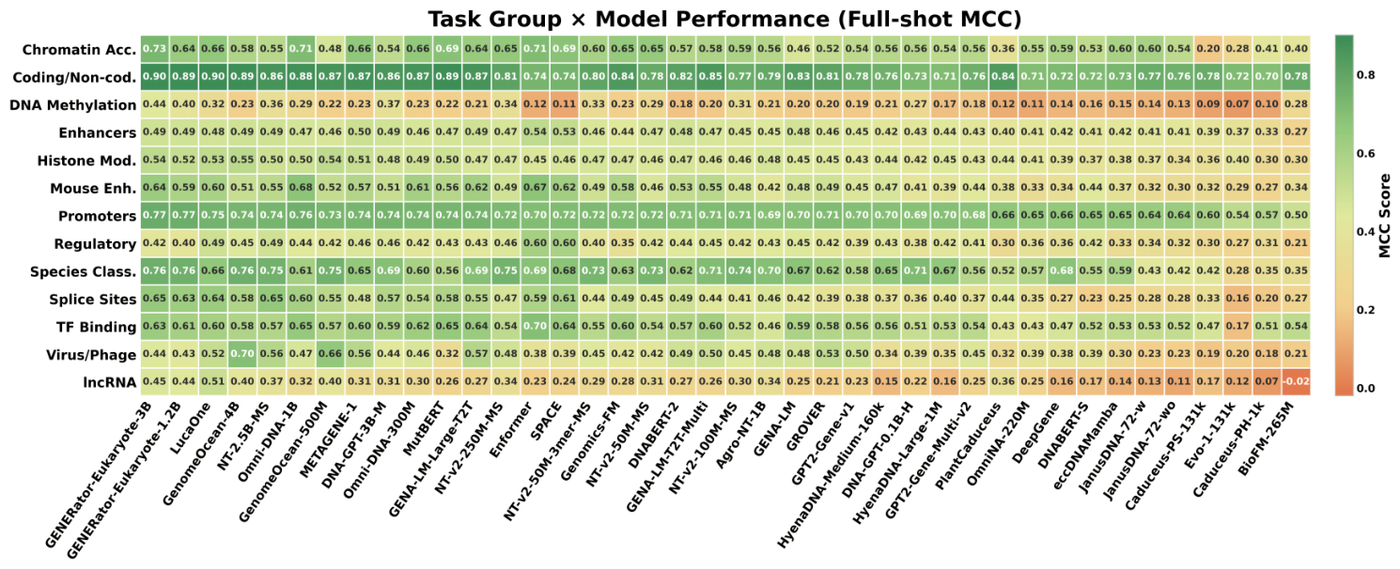 Figure 3: Full-shot Matthews correlation coefficient across 40 genomic foundation models and 13 task groups; the leaderboard is category-dependent, not absolute. Source: GENEB (Ledneva et al., arXiv:2606.04525, 2026)
DNA is not protein, and the benchmark history shows it. Protein structure prediction had CASP, a curated competition the field credits with making AlphaFold's progress legible.12 Genomics has historically lacked an equivalent, with similar challenges (genome annotation, functional element identification) but no folding-competition analogue.12 Part of why DNA models lag protein models on benchmarking maturity is biological: in DNA the signal can span an extremely long range, high-signal regions are sparse, and even within them the signal density is lower than in proteins.10 BEND's own finding is that current DNA language model embeddings can approach expert methods on some tasks but capture only limited information about long-range features.10 Keep that asymmetry in mind whenever a DNA result is presented with protein-level confidence.
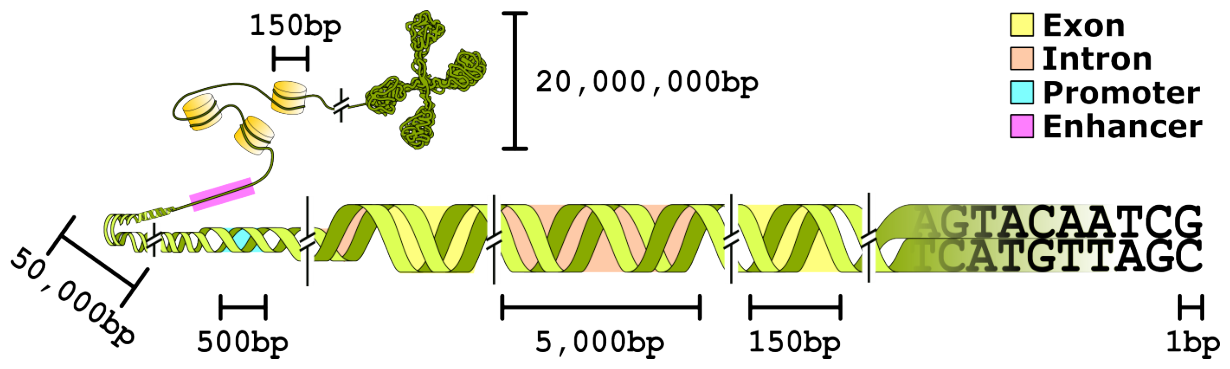 Figure 4: Organization of eukaryotic genomic DNA with indicative length scales, used to frame BEND's genome-annotation tasks and the long-range-feature challenge. Source: BEND (Marin et al., ICLR 2024)
With those caveats established, here is the map.
A map of the field
It helps to see the field as an architectural family tree before drilling into individual models. GENEB's taxonomy is a useful orientation: genomic foundation models split into Transformer-based families, state-space (Mamba) families, and convolution-hybrid families, and that architectural lineage turns out to predict task fit better than parameter count does.4
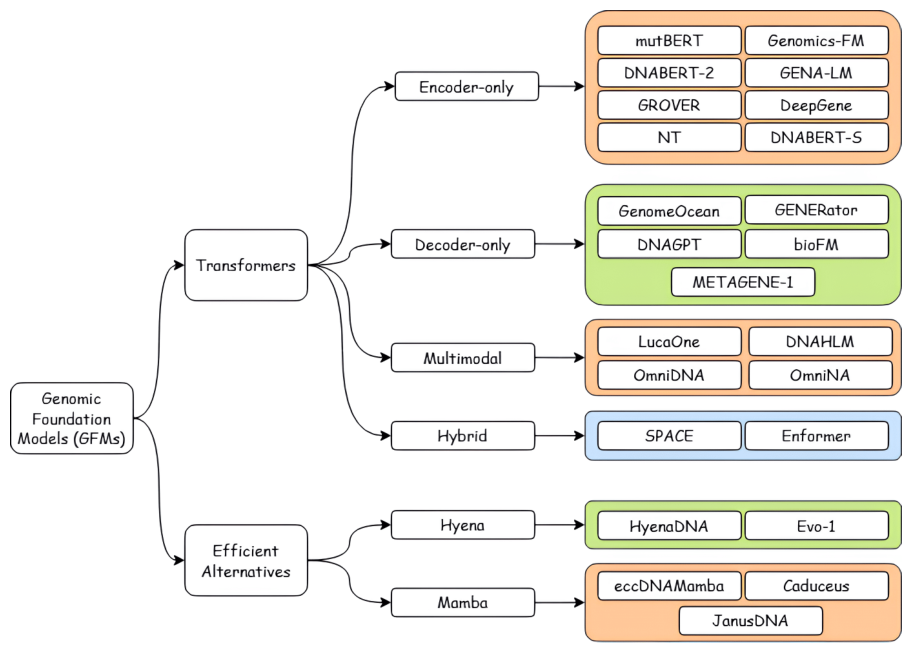 Figure 5: Architectural taxonomy of genomic foundation models, a map of the field before the per-model analysis. Source: GENEB (Ledneva et al., arXiv:2606.04525, 2026)
Two design axes dominate the DNA side. Evo 2 and AlphaGenome push scale and long context; Caduceus and HyenaDNA use efficient architectures with DNA-specific inductive biases. GENEB suggests that architecture and pretraining alignment frequently outweigh parameter count.4 A third axis matters more for the clinic: access. A versioned local model that a lab can freeze and audit is different from a hosted service, and a non-commercial research licence is different from permission for diagnostic deployment.
The capability ledger: DNA and genome-scale models
Evo 2: the scale-and-context frontier
Evo 2 comes in 7B and 40B parameter versions, trained on 2.4 trillion and 9.3 trillion DNA tokens respectively.1 Its StripedHyena 2 architecture mixes convolution and attention, then extends from an 8,192-token training stage to a 1-million-token context at single-nucleotide resolution.1 The authors report up to a threefold throughput improvement over optimized Transformer baselines at that longest context, plus successful retrieval of a 100 bp synthetic “needle” placed inside one million bases of random DNA.1 Code, weights, and the OpenGenome2 dataset are available, making the system unusually inspectable for its scale.1
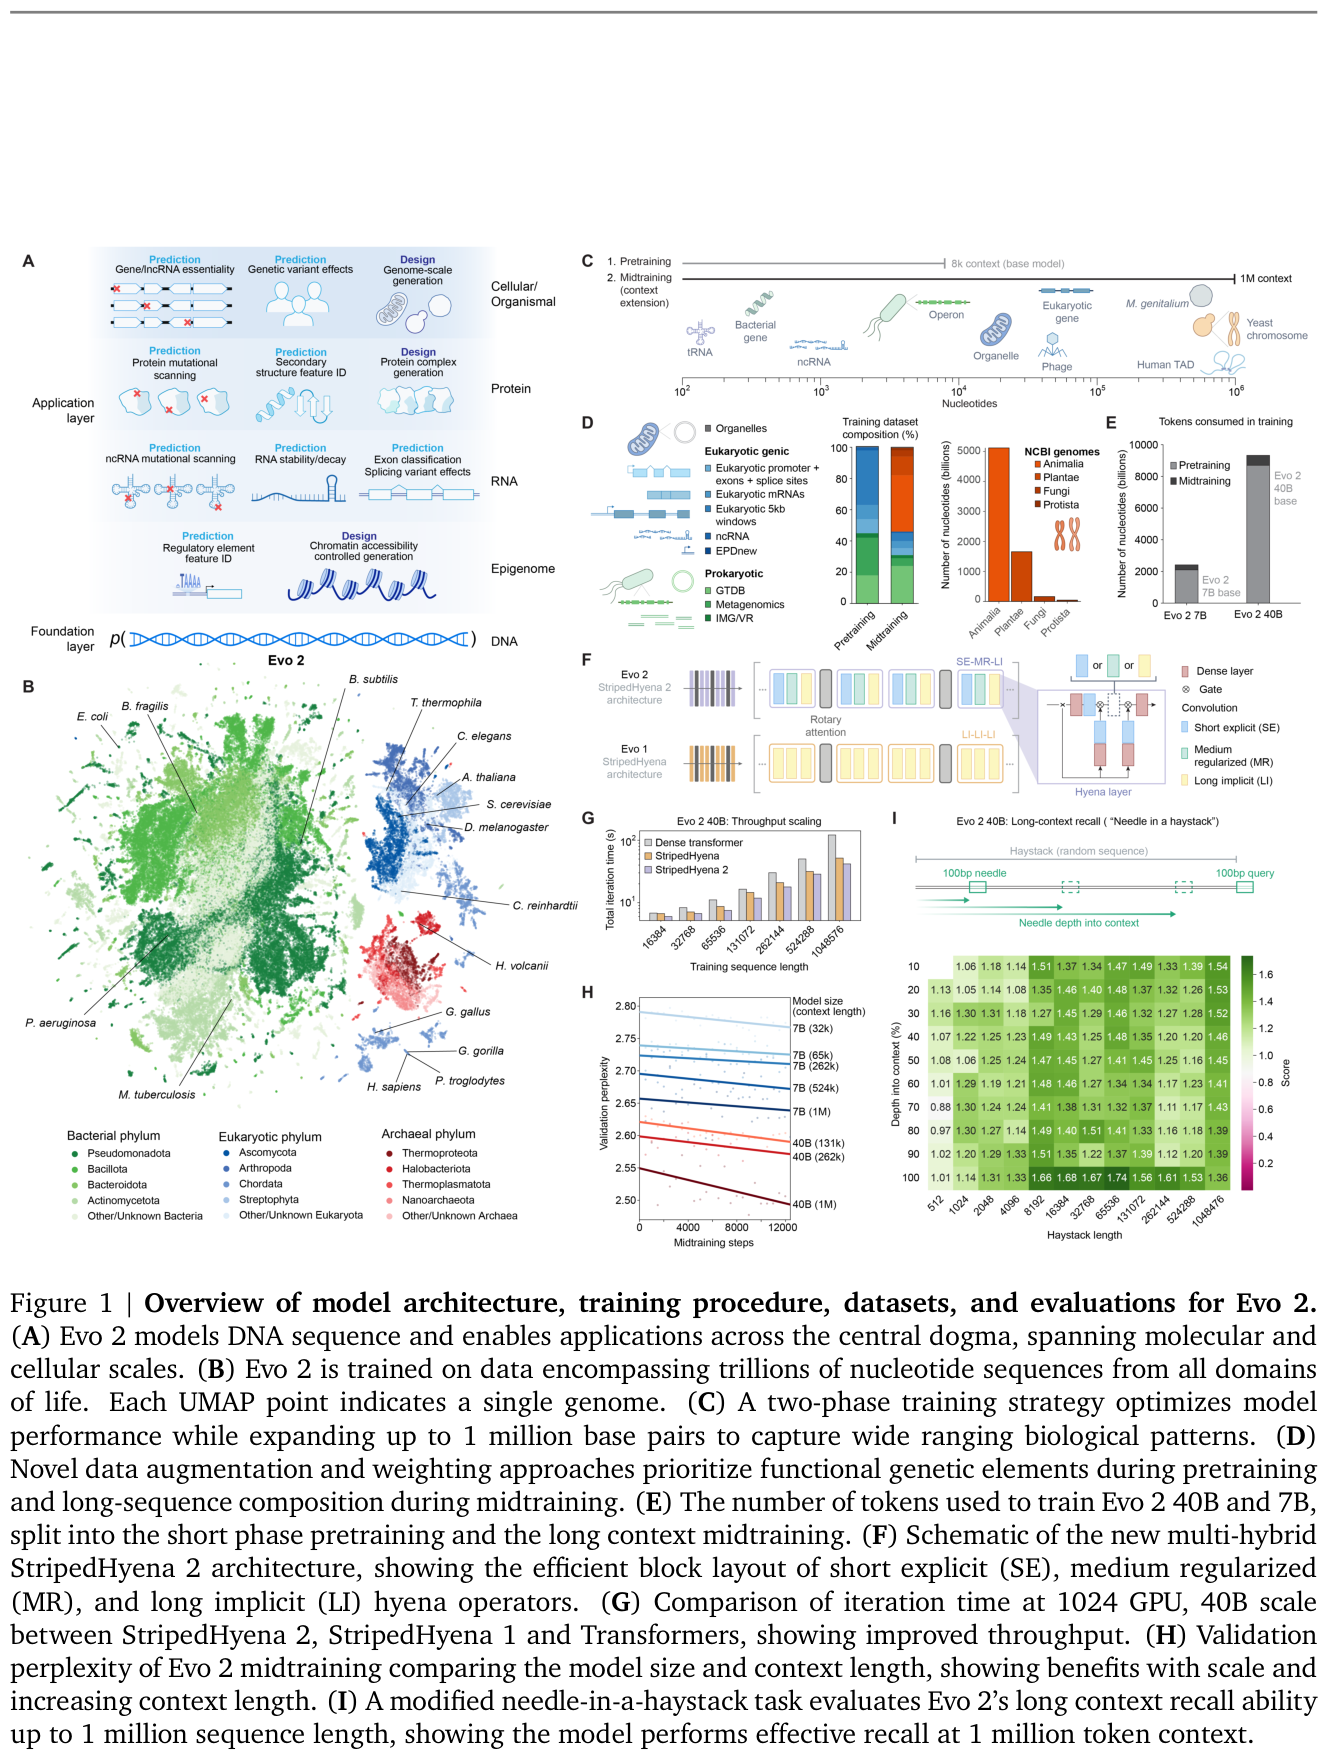 Figure 6: Evo 2 architecture, training data, and evaluation overview (40B parameters, 1M-token single-nucleotide context). Source: Evo 2 (Brixi et al., Nature 2026)
What it can do clinically is the interesting part, and it is also where Evo 2's authors are commendably honest. Evo 2 learns from DNA sequence alone to predict functional impacts of genetic variation without task-specific finetuning.1 But finetuning-free does not mean uniformly best. For single-nucleotide variants in coding regions, the 40B and 7B models ranked fourth and fifth, behind AlphaMissense, ESM-1b, and GPN-MSA.1 For noncoding variants, Evo 2 surpassed other models on both SNVs and non-SNVs,1 achieved the highest zero-shot performance on exonic and intronic splice variant effect prediction,1 and set a new state of the art for BRCA1 noncoding SNVs.1 An embedding-based exon classifier reached AUROCs of 0.82 to 0.99 across species.1 One negative result deserves repeating because it is rarely volunteered: Evo 2 showed no correlation between its likelihood and viral protein fitness for viruses that infect human hosts, a consequence of deliberately excluding those sequences from training.1 That is the honesty profile this audience should reward.
AlphaGenome: regulatory variant effect at base-pair resolution
AlphaGenome takes a different position on the same axis. It ingests 1 megabase of DNA and predicts thousands of functional tracks at up to single-base-pair resolution, spanning expression, splicing, chromatin state, and chromatin contacts.2 The final Nature paper reports that it matched or exceeded the strongest external model on 25 of 26 variant-effect evaluations and reached state of the art on 22 of 24 genome-track tasks.2 The first number is a win count, not an effect size: it says how often AlphaGenome led, not by how much.
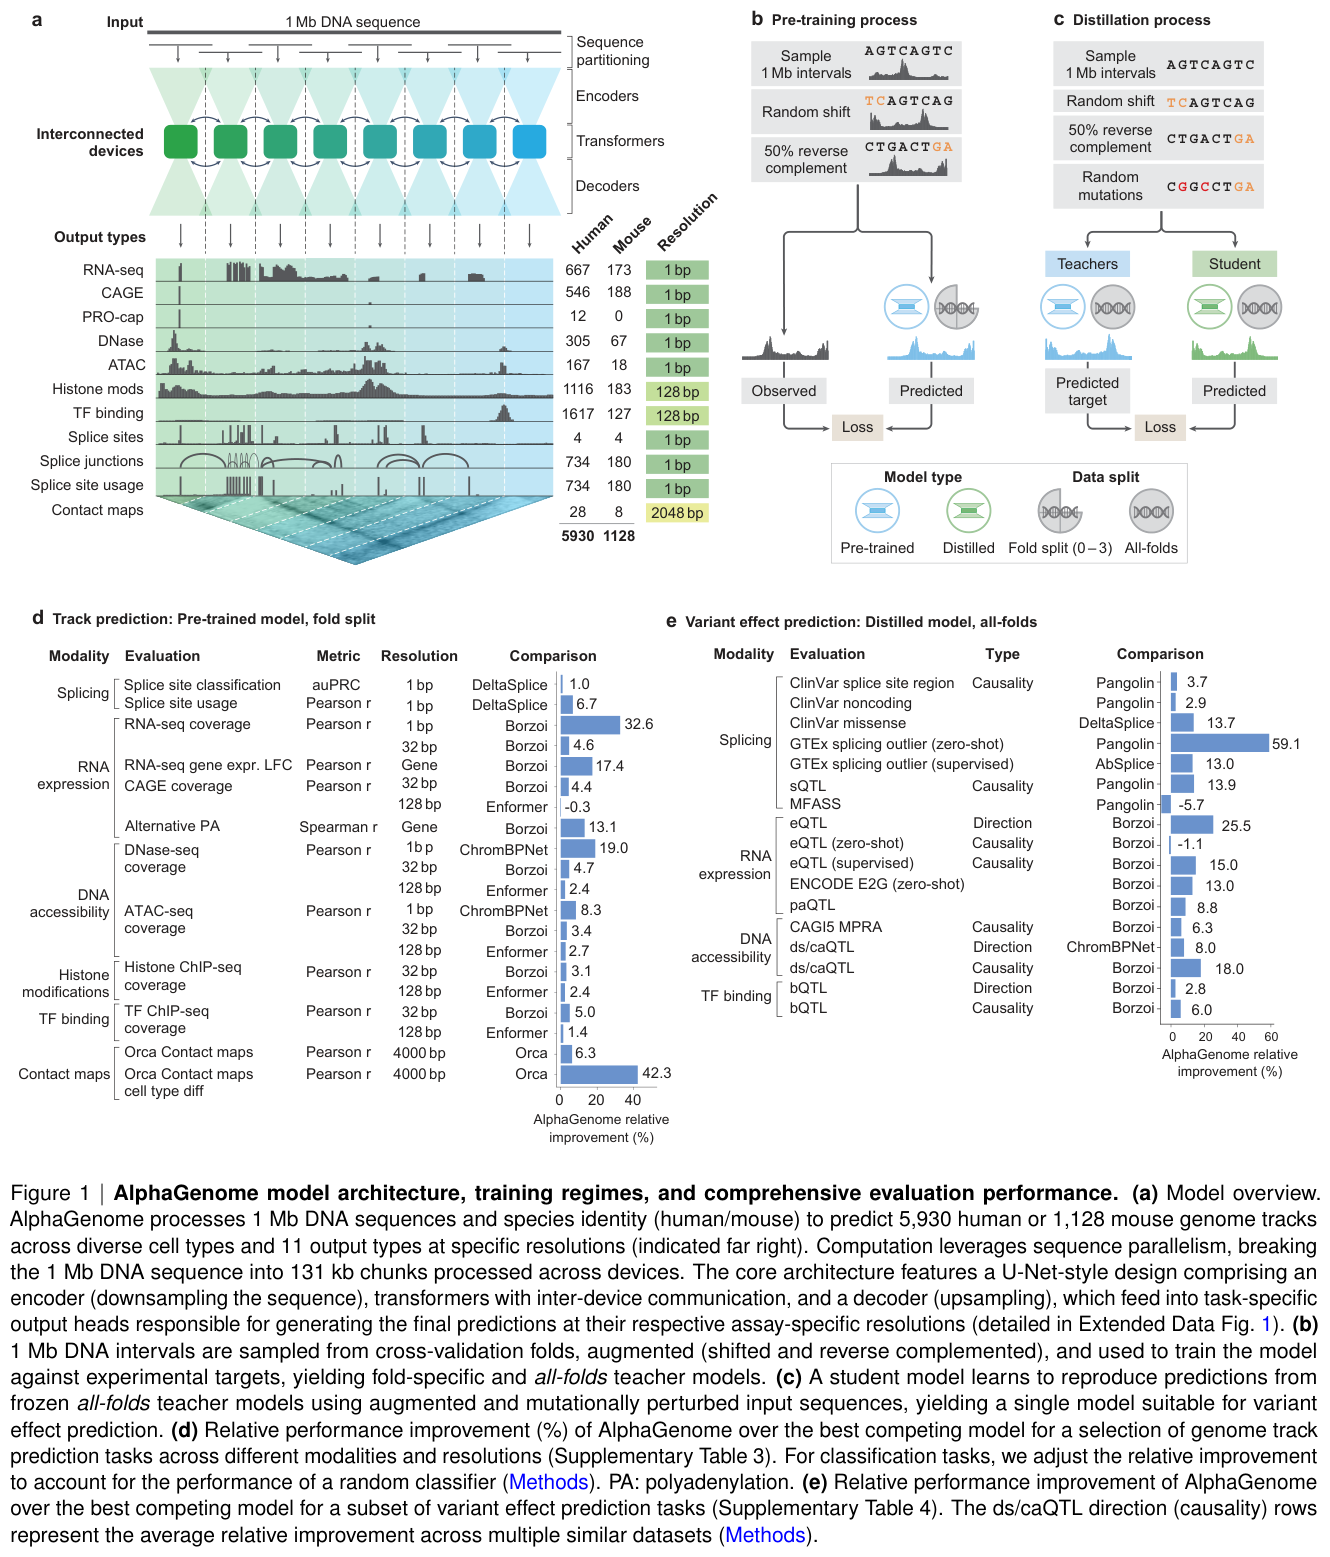 Figure 7: AlphaGenome architecture and evaluation overview (1 Mb input, base-pair resolution, multimodal output tracks). Source: AlphaGenome (Avsec et al., Nature 2026)
AlphaGenome is built to resolve a real tradeoff in the prior literature. Base-resolution models like SpliceAI were restricted to short inputs (10 kb or less), missing distal regulatory elements; longer-context models like Enformer and Borzoi reached 200 kb to 500 kb but only at reduced 128 bp or 32 bp output resolution.2 AlphaGenome's claim is to get both at once. It does so through a two-stage training process of pre-training then distillation, where a single student model is trained to reproduce an ensemble of teachers, and that student runs in under one second per variant on an NVIDIA H100.2 Base-pair training over the full 1 Mb sequence required sequence parallelism across 8 interconnected TPUv3 devices.2 The clinical relevance is direct: over 98 percent of observed human genetic variation is noncoding, and characterizing it globally is intractable without computational prediction.2 AlphaGenome is strongest exactly there, including splicing.
Two caveats belong on the same page as the headline. The authors note that a generalist can still lag a specialist on particular tasks.2 AlphaGenome is also no longer API-only: Google DeepMind publishes research code and downloadable pretrained weights through Kaggle and Hugging Face.13 The weights remain subject to non-commercial terms, and local inference is designed for H100-class hardware.13 A lab can therefore freeze a research version, but availability is not the same as licensing or validating it for diagnostic use.
Caduceus: the case that architecture beats scale
If Evo 2 and AlphaGenome are the scale argument, Caduceus is the counterargument, and it is the one I find most instructive. Caduceus is the first family of reverse-complement (RC) equivariant, bi-directional, long-range DNA language models, built on Mamba state-space modules rather than attention.8 The motivation is to encode the relationship between reverse-complement presentations of DNA, while checking whether the downstream task needs an invariant scalar or a transformed strand-specific output.8 Mamba blocks handle sequences of hundreds of thousands of nucleotides without the quadratic cost of attention.8
For a concrete strand example, write one orientation as 5′-ACGTA-3′. Reading the complementary strand in its own 5′-to-3′ direction gives 5′-TACGT-3′. Reversing the letters alone would give the wrong transformation. For an unstranded classification task, you usually want the same final scalar for both presentations. A per-base output instead needs its positions reversed and, where relevant, its strand channels exchanged.
The released variants achieve different things: Caduceus-PS builds reverse-complement equivariance into parameter sharing; Caduceus-Ph uses reverse-complement data augmentation. Bidirectionality means using context on both sides of a base and does not by itself enforce this symmetry. Augmenting training data encourages consistency, while averaging predictions over both orientations is an inference procedure. An equivariant backbone still needs compatible pooling and a compatible task head to preserve the desired final-output relationship (paper, release documentation).
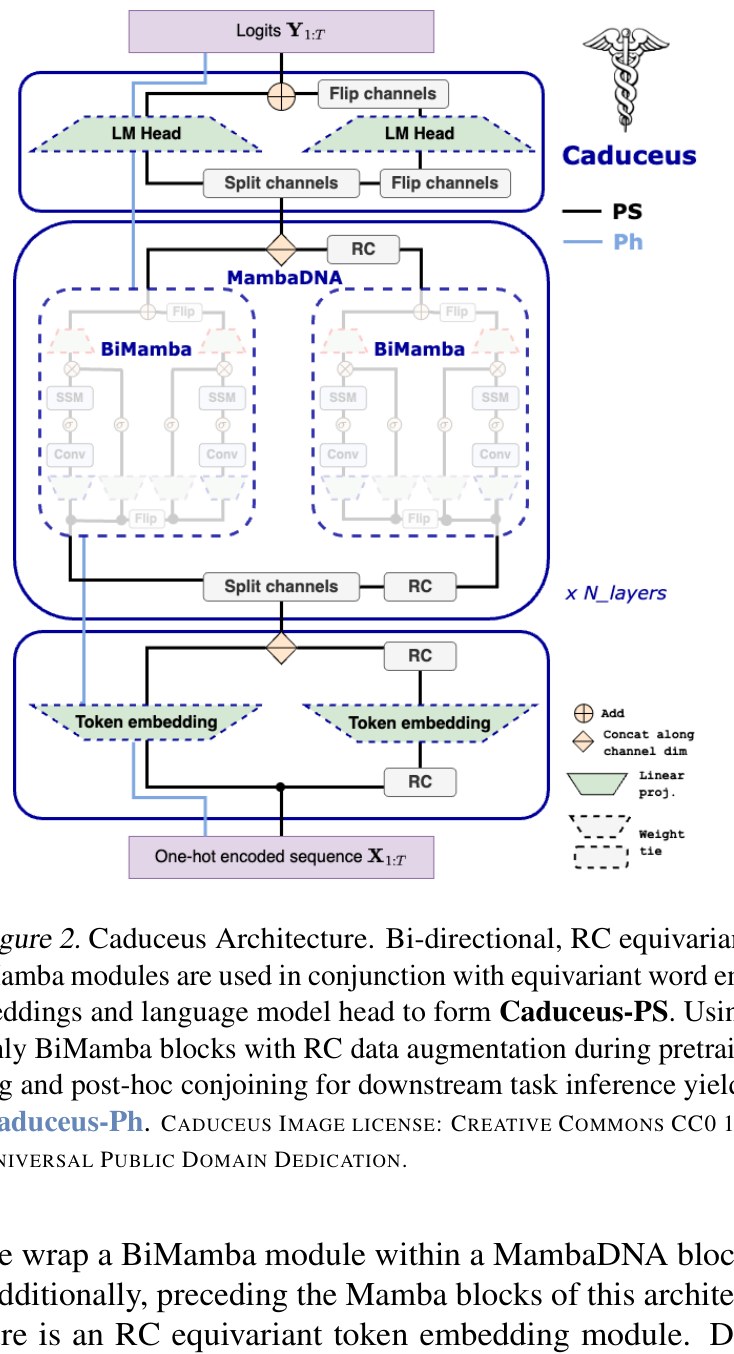 Figure 8: Black paths show Caduceus-PS parameter sharing; blue paths show Caduceus-Ph. Both use bidirectional context, but Ph relies on augmentation and post-hoc conjoining rather than architectural RC equivariance. Source: Caduceus (Schiff et al., ICML 2024)
The result that should make every scaling enthusiast pause: on a challenging long-range variant effect prediction task, Caduceus exceeded the performance of models 10 times larger that did not use bi-directionality or equivariance.8 The advantage is strongest precisely where it should be, at long distances from the transcription start site.
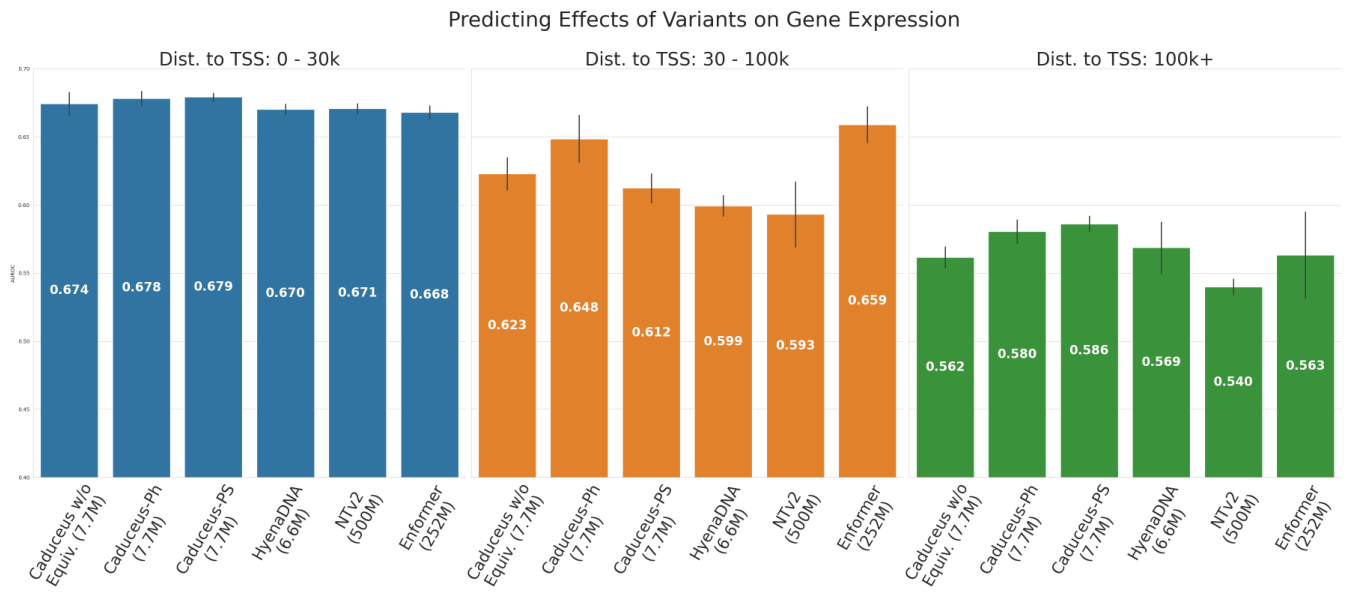 Figure 9: Variant-effect prediction on gene expression across distance bins to the nearest TSS, showing the Caduceus advantage at long range versus larger non-equivariant models. Source: Caduceus (Schiff et al., ICML 2024)
GENEB corroborates this at the level of the whole field. Its model-size-versus-performance Pareto frontier puts small, architecture-aligned models on or near the frontier while some large models sit below it.4 Parameter count is not destiny.
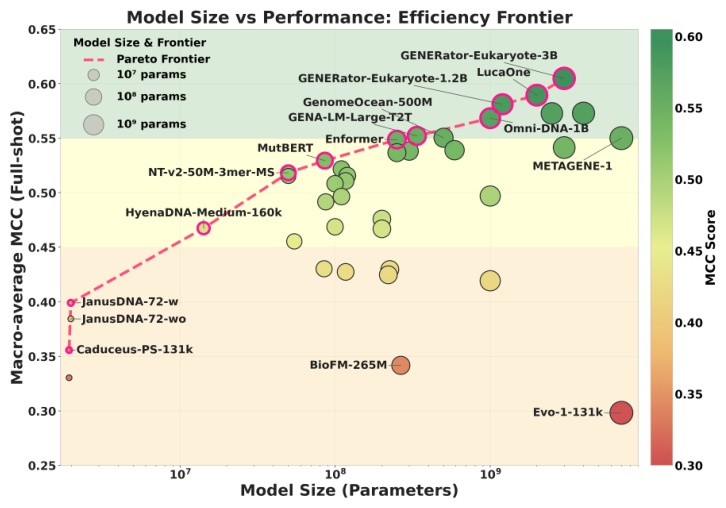 Figure 10: Model size versus macro-average MCC across 40 genomic foundation models; several small, architecture-aligned models sit on or near the frontier, so parameter count alone is not predictive. Source: GENEB (Ledneva et al., arXiv:2606.04525, 2026)
The efficient lineage
The smaller models make the anti-scaling case from two directions. HyenaDNA reached a one-million-token context at single-nucleotide resolution and, in the authors' specified long-sequence comparison, trained up to 160 times faster than a Transformer.5 DNABERT-2 attacked the tokenization and compute budget instead: its authors report comparable performance with 21 times fewer parameters and roughly 92 times less pretraining GPU time, plus wins over DNABERT on 23 of 28 GUE datasets.7 GENA-LM offers a peer-reviewed, open-weight Transformer family with inputs up to 36,000 bases and recurrent memory for longer sequences.14
These are author-reported comparisons on particular hardware and task suites, not universal efficiency rankings. Their shared lesson is narrower and more useful: a 2.5-billion-parameter Transformer is no longer the automatic default when a smaller architecture better matches the sequence problem.54
Variant effect prediction: where the two ledgers nearly agree
If there is one task where foundation models have earned a place in the clinical conversation, it is variant effect prediction, and the reason is that this is the task with a real, standardized, clinically-labeled yardstick. This is the corner where the capability ledger and the validity ledger come closest to agreeing.
On the protein side that yardstick is ProteinGym: over 250 standardized deep mutational scanning assays comprising more than 2.7 million mutated sequences across more than 200 protein families, plus a clinical benchmark of roughly 65,000 substitution and indel mutations in human genes annotated by domain experts.15 It evaluates over 70 models across zero-shot and supervised settings.15 The motivation is exactly the comparability problem this whole article is about: prior protein predictors were evaluated on distinct, sparse datasets while relative performance fluctuated importantly across assays.15
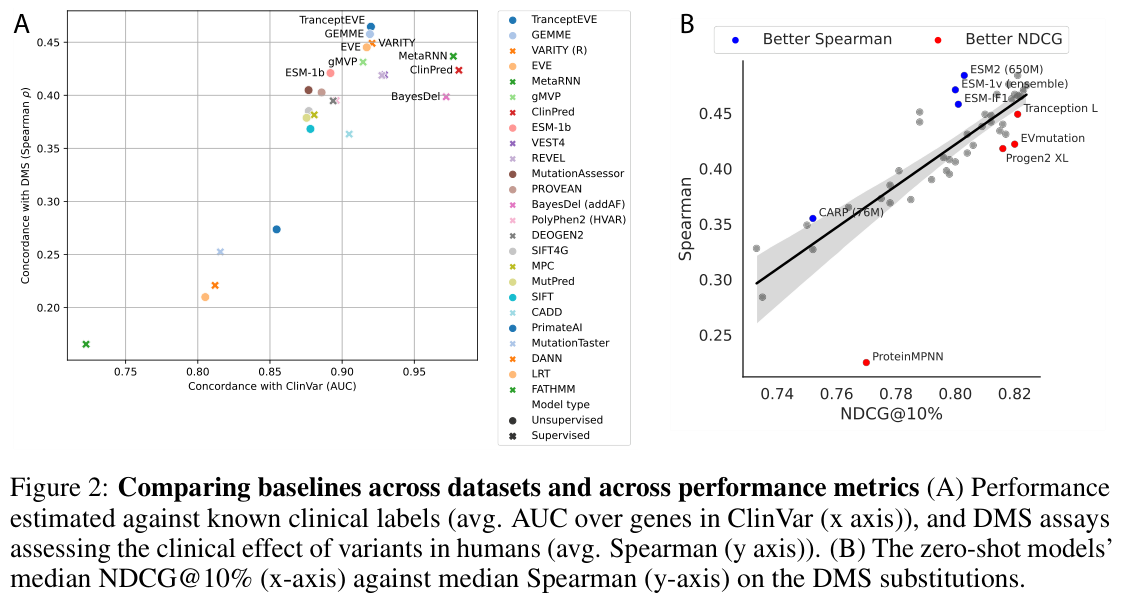 Figure 11: Clinical concordance versus DMS performance for protein-LM variant-effect predictors, the closest the field has to a clinical variant-effect leaderboard. Source: ProteinGym (Notin et al., NeurIPS 2023)
On the DNA side, Evo 2's clinical variant-effect panel is the closest equivalent, spanning ClinVar coding and noncoding variants, splice-altering variants, loss-of-function classification, and the BRCA1 saturation-mutagenesis benchmark.
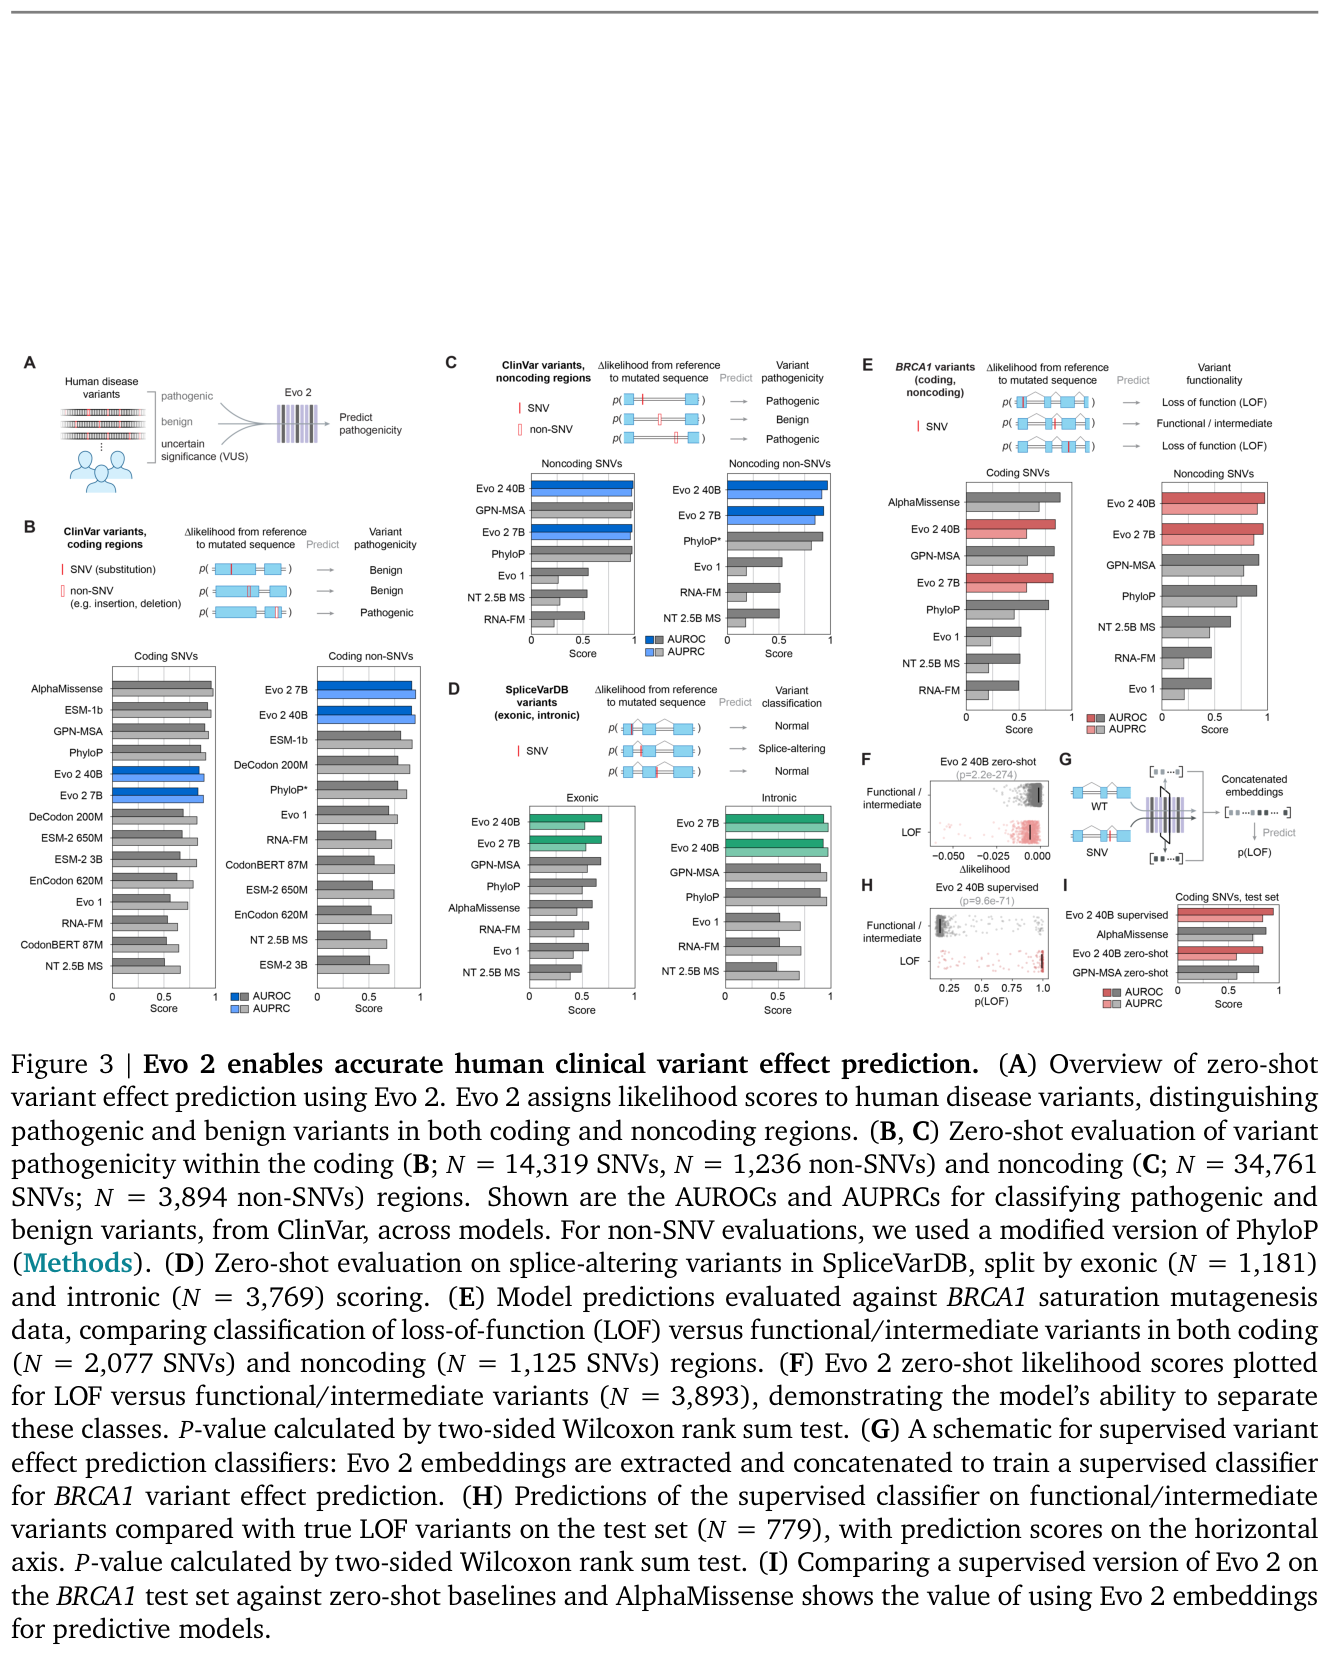 Figure 12: Evo 2 zero-shot clinical variant-effect prediction versus baselines, including the BRCA1 saturation-mutagenesis benchmark. Source: Evo 2 (Brixi et al., Nature 2026)
Read the two panels together and the task dependence becomes visible. Protein language models are competitive on standardized protein-variant labels.15 DNA models lead the reported noncoding and splicing comparisons but not coding SNVs, where specialists such as AlphaMissense still lead.1 That earns the scores a place in validation studies, not generic ACMG/AMP status. ClinGen-style PP3/BP4 evidence requires a prespecified tool, version, variant class, and calibrated threshold; default thresholds may not even reach supporting strength.16 The useful clinical question is therefore not “does this model support PP3?” but “has this exact score been calibrated for this exact use?”
Protein and structure models
The protein-structure story is where foundation models first earned the field's trust, and it is also where the speed-versus-accuracy tradeoff is best quantified, because there is independent third-party benchmarking rather than vendor self-report.
ESM-2 and ESMFold made the foundational observation: as protein language models scale from 8 million to 15 billion parameters, an atomic-resolution picture of protein structure emerges in the learned representations, enabling an order-of-magnitude acceleration of high-resolution structure prediction.17 Perplexity falls with scale, with the 8-million-parameter model sitting at 10.45.17 Because ESMFold is MSA-free and works from a single sequence, the speedup over prior pipelines is up to one to two orders of magnitude.17 That speed enabled the ESM Metagenomic Atlas: structures for more than 617 million metagenomic proteins, including over 225 million high-confidence predictions, computed in two weeks on a cluster of 2,000 GPUs.17 Many of those predictions were genuinely novel, with 76.8 percent of high-confidence predictions at least 90 percent distinct from UniRef90 and 12.6 percent lacking any match to experimentally determined structures.17
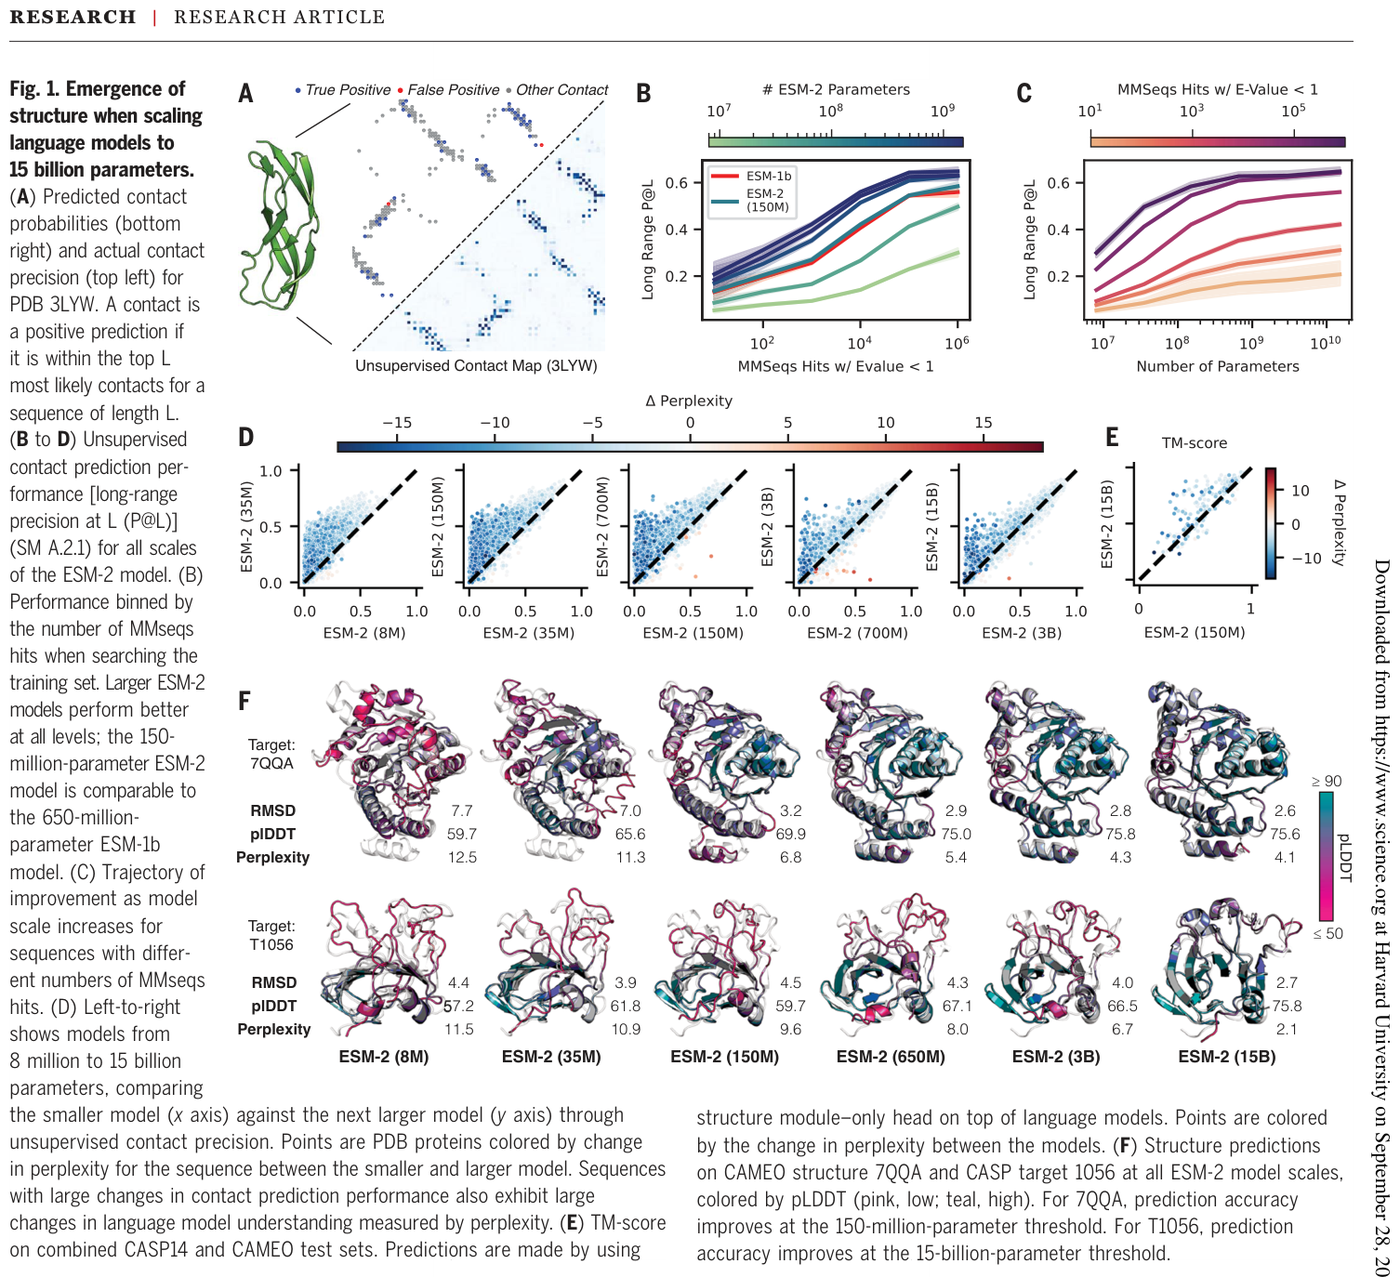 Figure 13: Emergence of protein structure with scale: contact-map precision and example ESMFold predictions improving from 8M to 15B parameters. Source: ESM-2 / ESMFold (Lin et al., Science 2023)
The honest tradeoff comes from an independent 2025-2026 comparison that benchmarked AlphaFold2, AlphaFold3, and ESMFold on deliberately challenging targets: 1,666 monomers and 994 dimers selected at under 40 percent sequence identity and under 70 percent query coverage.18 On those targets, AlphaFold2 and AlphaFold3 correctly predicted 88 percent of monomeric structures and 77 percent of dimeric proteins, while ESMFold predicted 76 percent of monomers and 41 percent of dimers.18 On X-ray and cryo-EM monomers the accuracy was 95 percent for AlphaFold versus 83 percent for ESMFold.18 The summary that survives scrutiny: ESMFold for speed and scale, AlphaFold for accuracy, with the gap widening sharply on complexes.
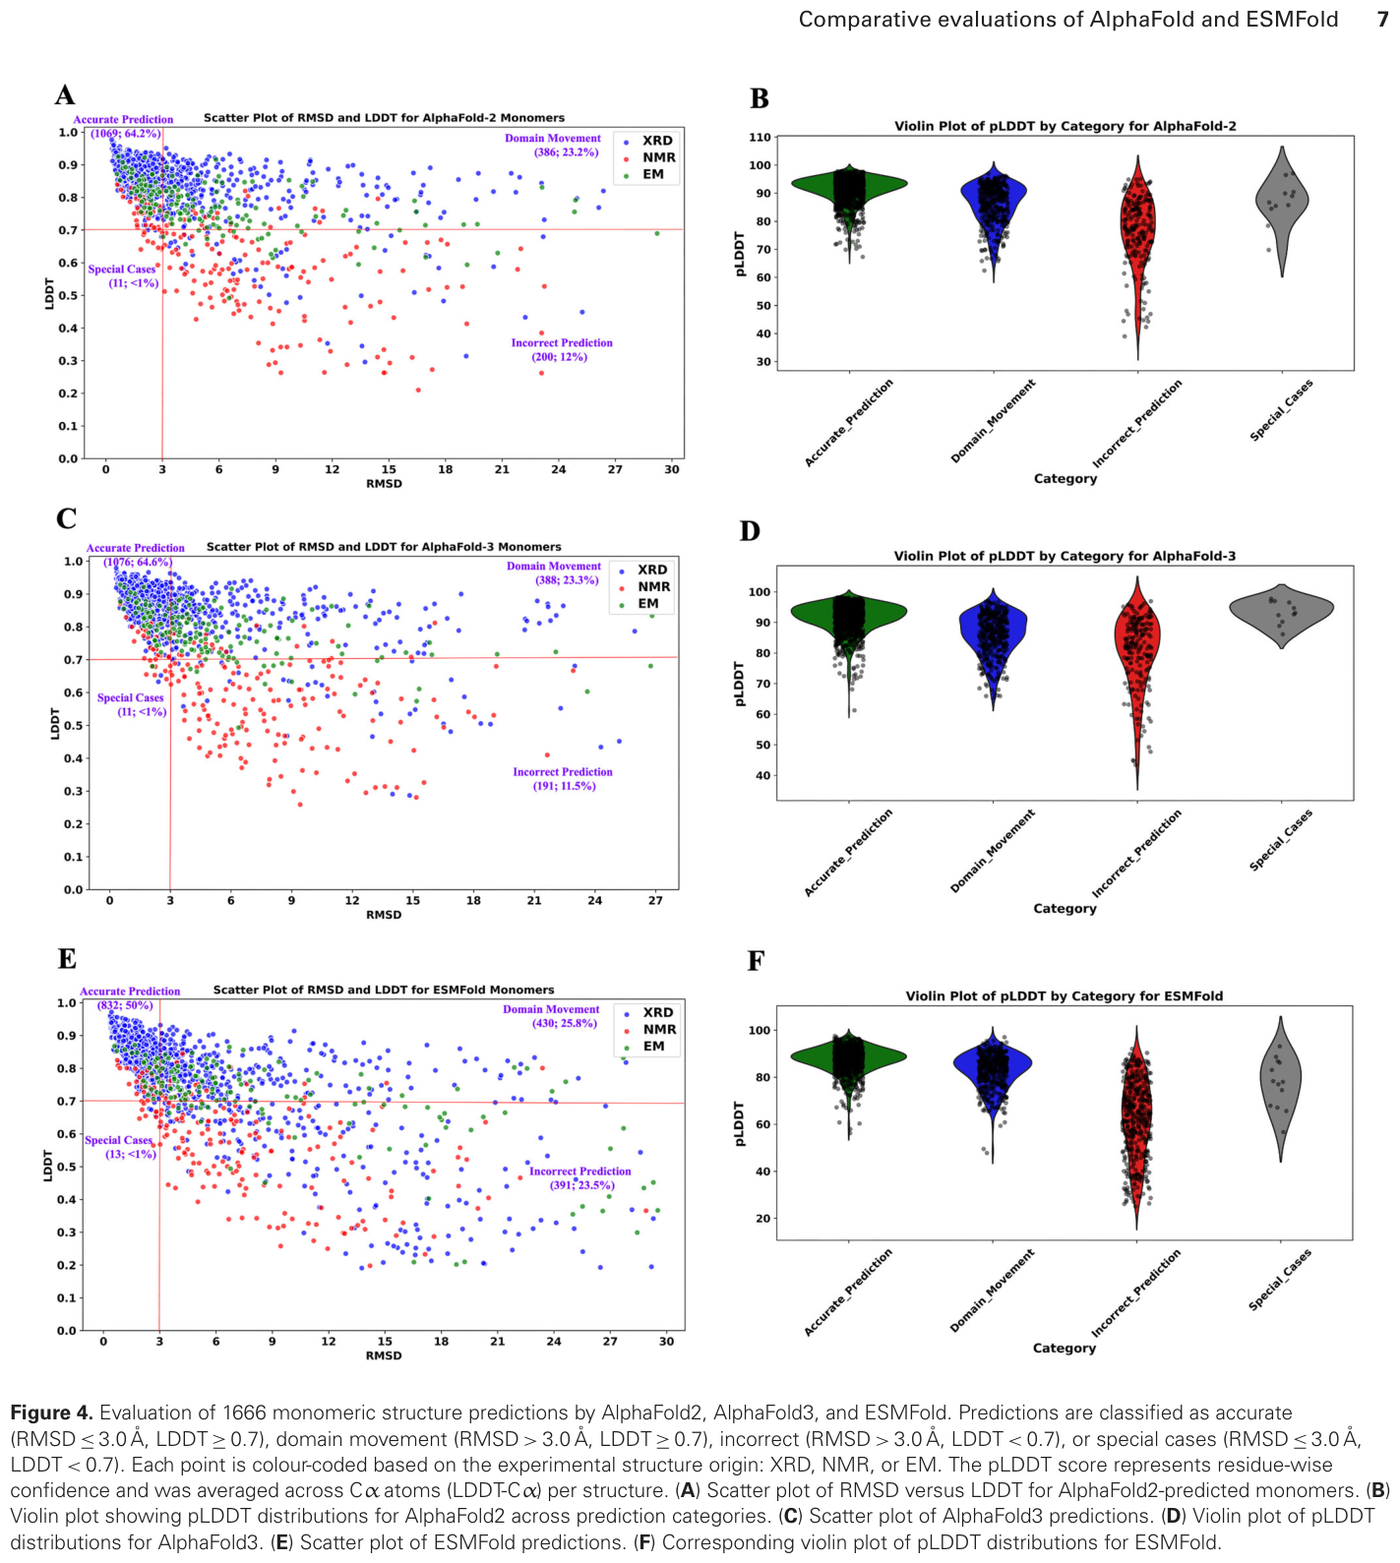 Figure 14: Independent evaluation of monomeric structure predictions by AlphaFold2, AlphaFold3, and ESMFold. Source: ESMFold vs AlphaFold comparison (PMC12809598, 2026)
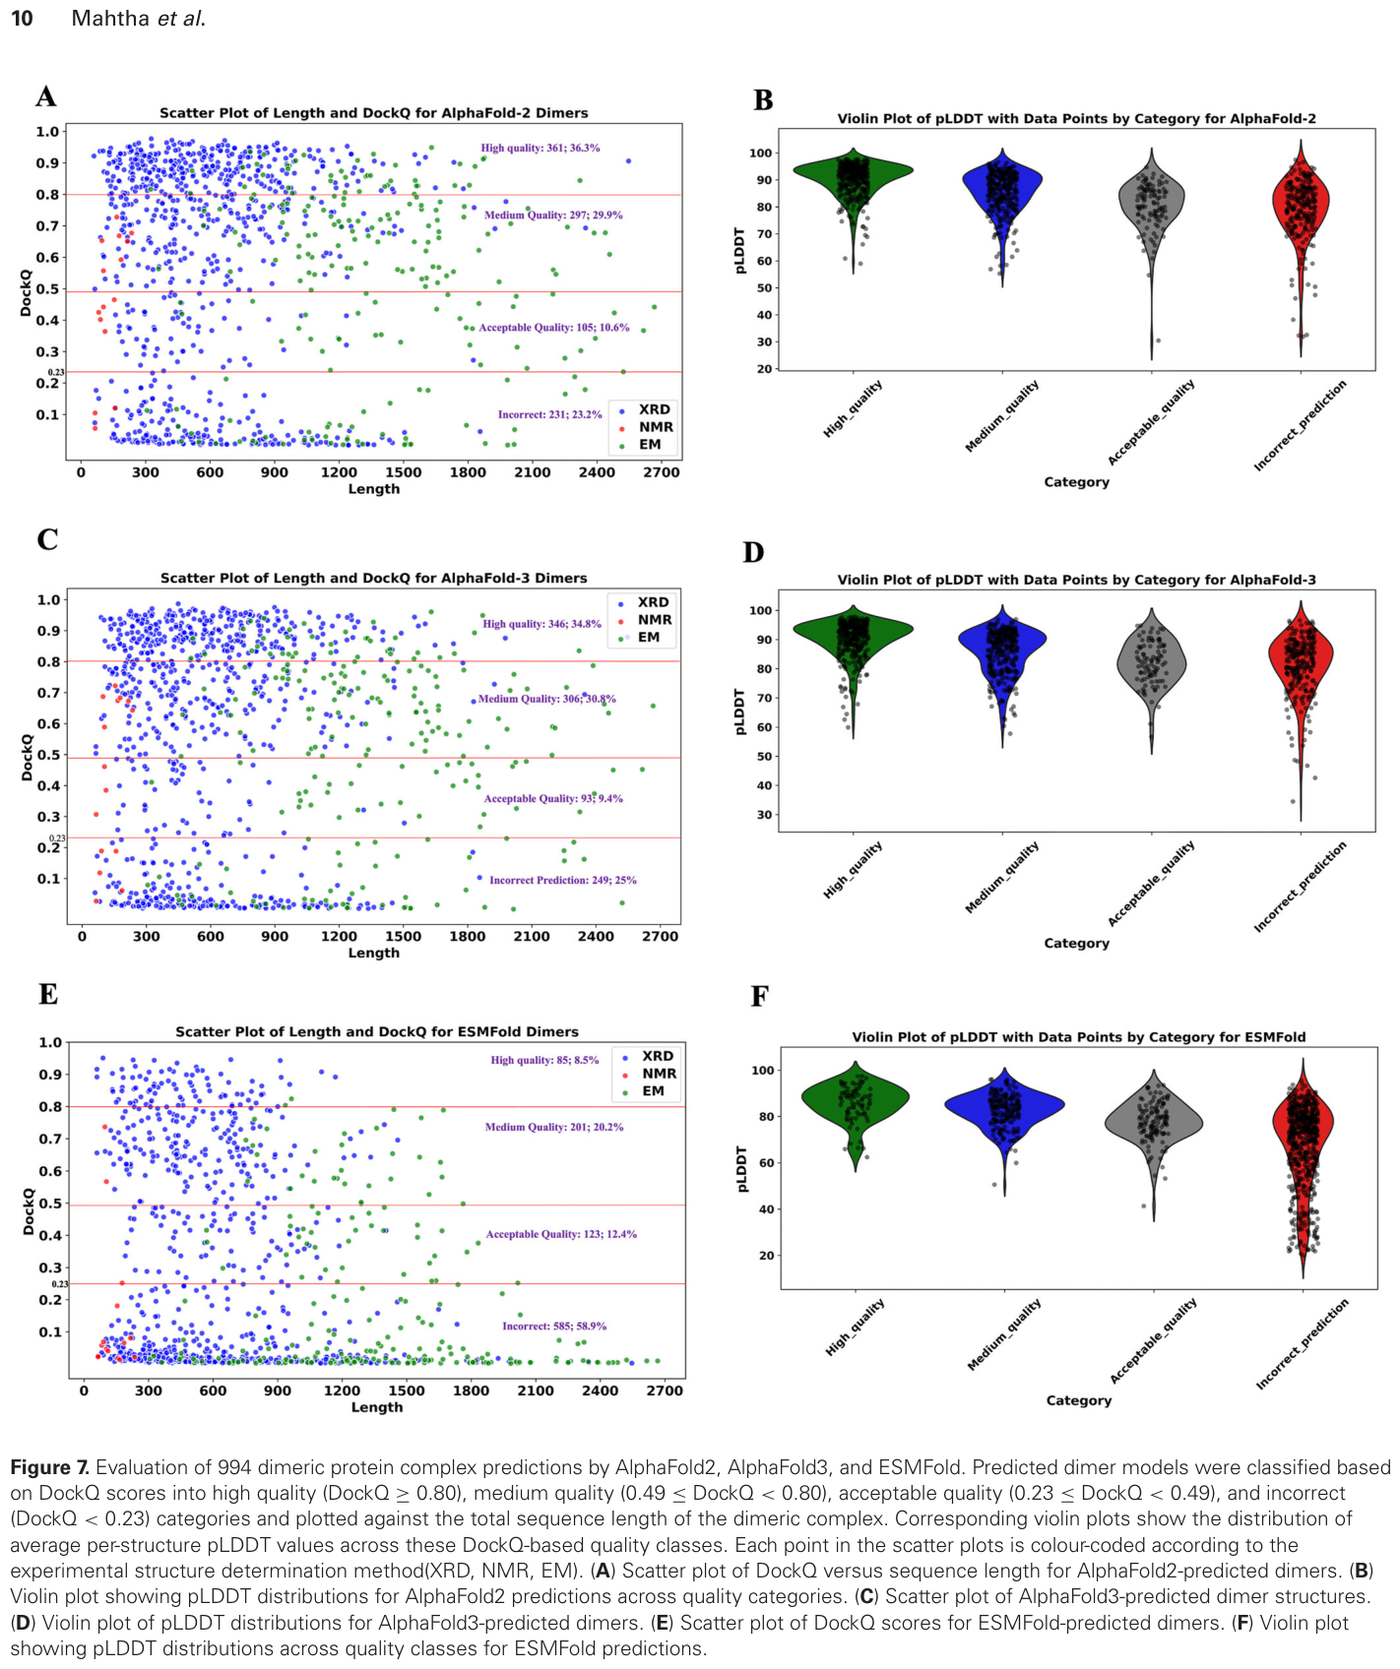 Figure 15: Evaluation of dimeric (protein-protein complex) predictions by AlphaFold2, AlphaFold3, and ESMFold, classified by DockQ accuracy. Source: ESMFold vs AlphaFold comparison (PMC12809598, 2026)
The reason complexes matter is the same reason the field moved to all-atom models. AlphaFold3 extends structure prediction to protein-protein interactions, protein-ligand docking, and protein-nucleic-acid complexes,19 partly by distilling from AF2-generated structures of 41 million MGnify sequences.19 But it carries documented failure modes that a clinical user must know: 4.4 percent of top PoseBusters predictions had a chirality violation, and such violations persisted even when ranking 1,000 predictions with a 100x penalty;19 AF3 may hallucinate structure;19 and antibodies are unreliable because every B cell carries a distinctly shuffled, hypermutated sequence that lacks a usable MSA.19 Because AF3 outputs static structures, disordered regions and multi-state conformations remain hard.19
RoseTTAFold All-Atom is the open, design-capable counterpart. Prior deep-learning structure methods were limited to protein-only systems;20 RFAA combines a residue-based representation of amino acids and DNA bases with an atomic representation of all other groups, modeling assemblies of proteins, nucleic acids, small molecules, metals, and covalent modifications from their sequences and chemical structures.20 Its nucleic-acid predecessor did this by expanding the residue alphabet to 28, covering 20 amino acids, 4 DNA bases, and 4 RNA bases.20 Finetuned for denoising, RFdiffusionAA designs proteins around small molecules, with experimentally validated binders for the cardiac therapeutic digoxigenin, the cofactor heme, and the light-harvesting molecule bilin.20 The honest framing, reported in the AlphaFold 3 work itself, is that an all-atom generalist can model every interaction type but underperforms specialist methods on any single one, while specialist methods simply fail when a complex contains multiple interaction types.19 Generalist versus specialist is the recurring shape of this entire field.
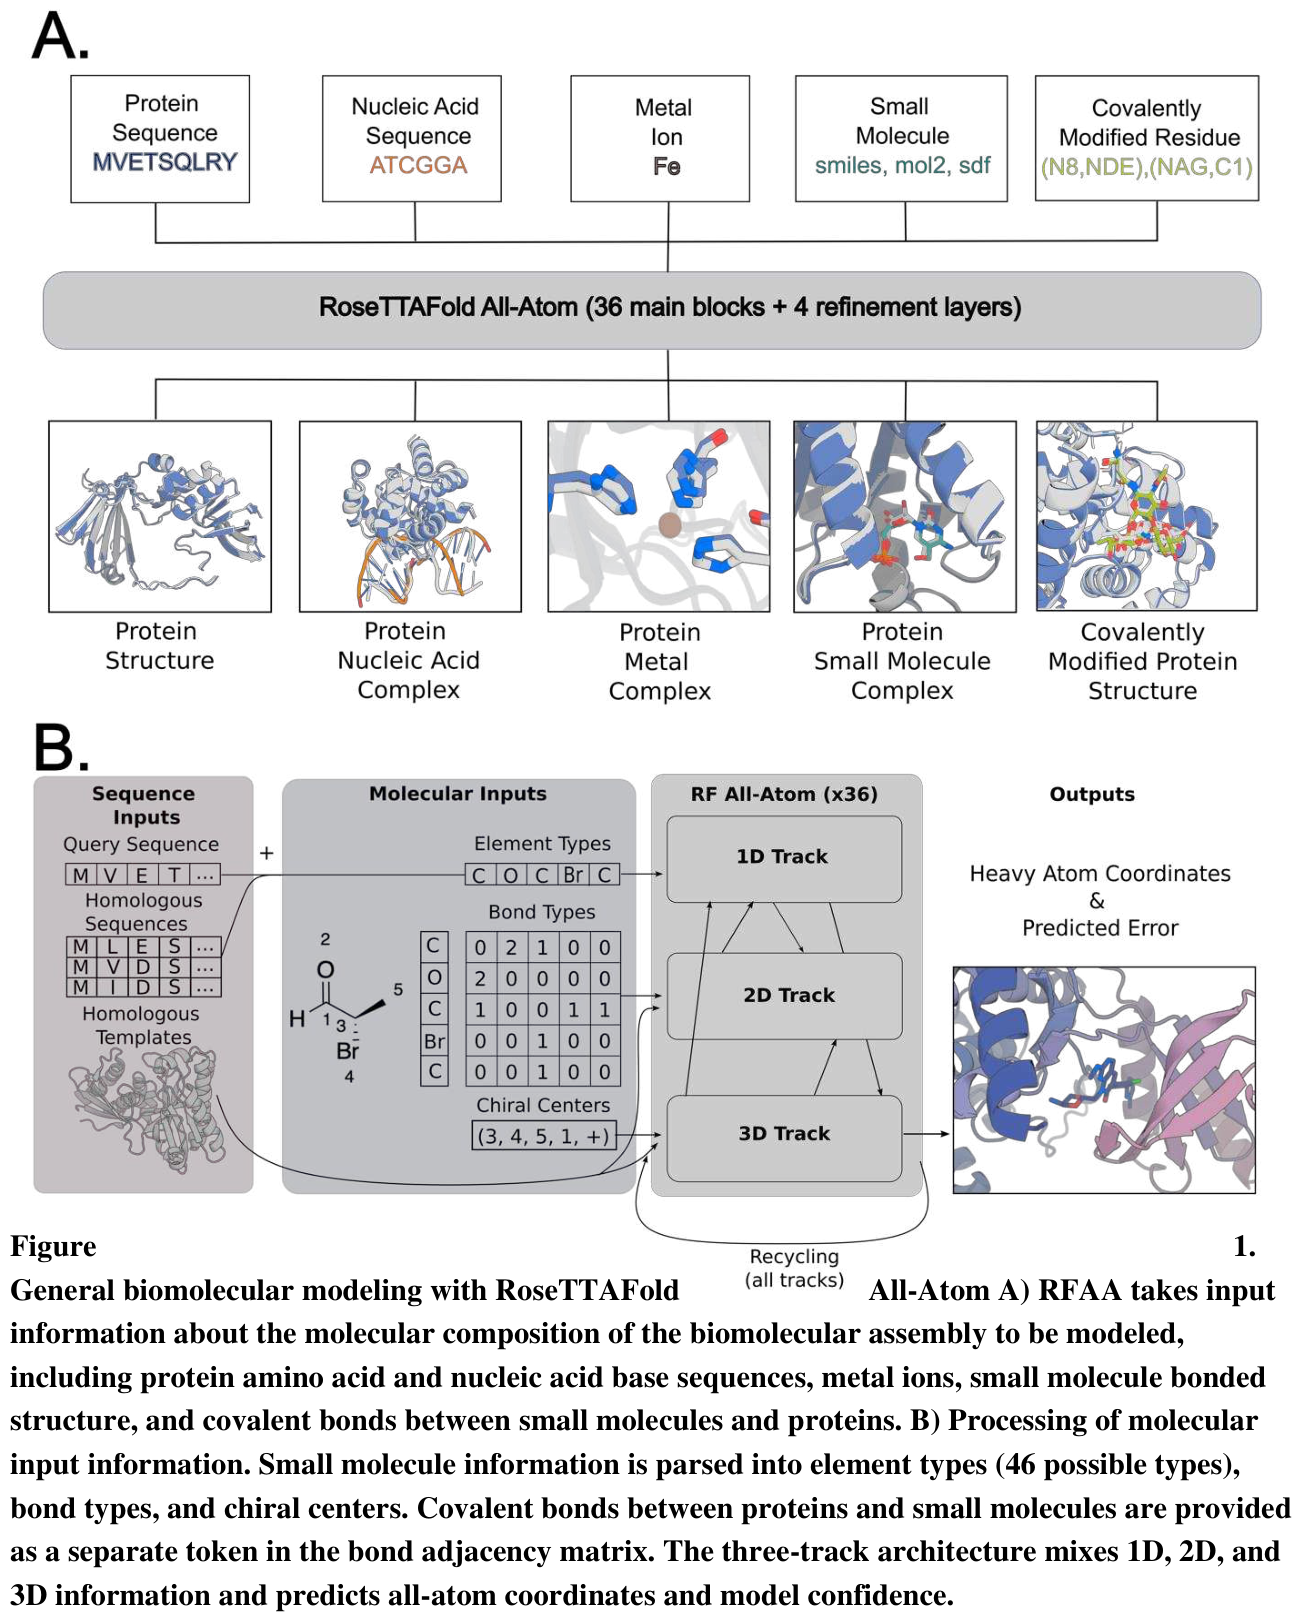 Figure 16: RoseTTAFold All-Atom's general biomolecular representation and three-track architecture. Source: RoseTTAFold All-Atom (Krishna et al., Science 2024)
ESM3 extends this trajectory toward multimodal generation over protein sequence, structure, and function jointly, which is the direction the protein field is now moving. I am keeping its specific numbers out of this comparison because I could not verify them against a primary archived source, and an unverifiable parameter count has no place in a piece for this audience. Treat it as a qualitative signpost, not a benchmarked entry.
Single-cell and expression models: where the validity ledger is thinnest
Single-cell foundation models are trained at impressive scale. scGPT was pretrained on roughly 33 million non-cancerous human cells;9 Geneformer's current generation is the V2-316M model;21 UCE is a 33-layer model with over 650 million parameters trained on more than 300 datasets totaling over 36 million cells across 8 species, for 40 days on 24 A100 80GB GPUs.22 UCE is interesting architecturally because it represents genes via protein-language-model embeddings to build a universal cross-species latent space and can zero-shot embed cells from species it never saw in training.22 On the capability ledger, these are real and large. The validity ledger is where they thin out, and it is the reason I would not let a single-cell foundation model near a clinical decision today.
The flagship result is from Nature Methods in 2025. Ahlmann-Eltze, Huber, and Anders compared five foundation models and two other deep-learning methods against deliberately simple baselines for predicting transcriptome changes after single or double gene perturbations. None outperformed the baselines.3 For double perturbations, every model had a prediction error substantially higher than a simple additive baseline.3 For single perturbations, none of the deep models consistently beat the mean prediction or the linear model.3 Pretraining on the single-cell atlas provided only a small benefit over random embeddings; only pretraining on perturbation data itself helped.3 The authors' conclusion is the calibrated version of the skeptical case, and it is worth reading aloud: because their deliberately simple baselines cannot represent realistic biological complexity yet were not outperformed, the foundation models' goal of a generalizable representation of cellular states that predicts not-yet-performed experiments is still elusive.3 For context on why this is hard, the same study found only 5,035 genetic interactions out of a potential 124,000 at a 5 percent false discovery rate.3
The zero-shot picture is just as sobering, and zero-shot is the realistic discovery scenario, where you have not finetuned on the answer. Kedzierska and colleagues evaluated Geneformer and scGPT zero-shot and found they may face reliability challenges and can be outperformed by simpler methods.9 Both performed worse than selecting highly variable genes and using established methods like Harmony and scVI for cell-type clustering, as measured by the AvgBio score.9 Highly variable gene selection outperformed Geneformer and scGPT across all metrics.9 They even varied scGPT's pretraining scale across 814,000, 10.3 million, and 33 million cells and still found the only previously-unseen dataset where scGPT beat both baselines was a single PBMC study.9 The structural lesson is the one to keep: strong finetuned benchmark numbers can mask weak general representations, which is why the authors call zero-shot evaluation a critical step before deployment.9
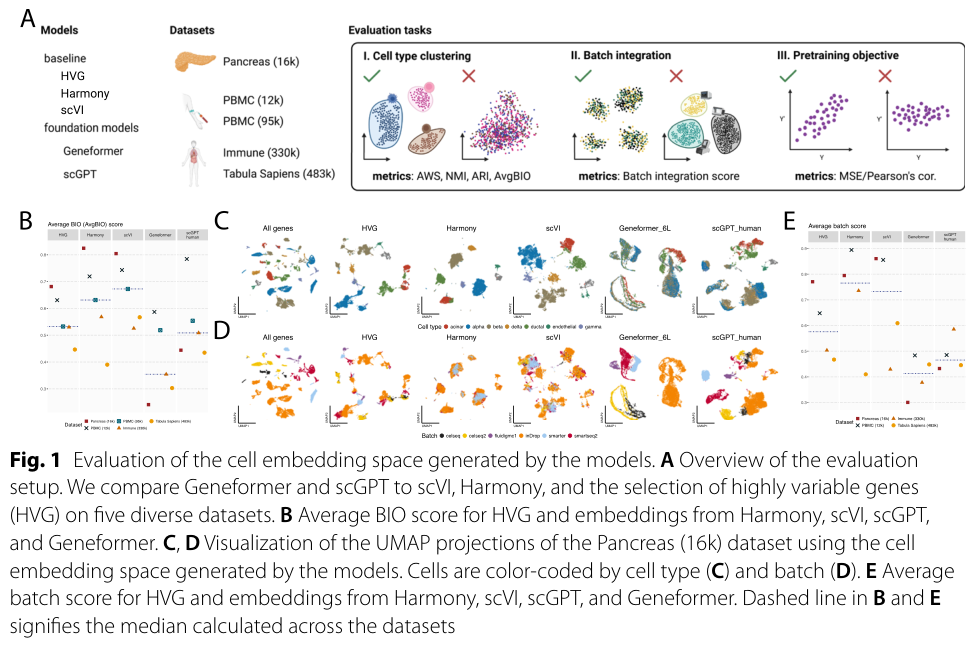 Figure 17: Zero-shot evaluation of the cell-embedding space of Geneformer and scGPT versus simple baselines. Source: Kedzierska et al., Genome Biology 2025
The interpretability result is subtler than “attention explains regulation.” A peer-reviewed 2026 evaluation ran 37 analyses and 153 statistical tests across four cell types and two perturbation modalities.21 It found structured, layer-specific biological signal in attention and improved curated gene-regulatory-network recovery with a cell-state-stratified method.21 But for perturbation-target prediction, pairwise attention edges added no value over gene-level features: simple baselines reached AUROC 0.81 to 0.88, while attention and correlation edges were near 0.70, and ablating supposedly regulatory heads did not degrade performance.21 Attention contains structure; this study does not support treating its raw edge scores as a regulatory oracle.
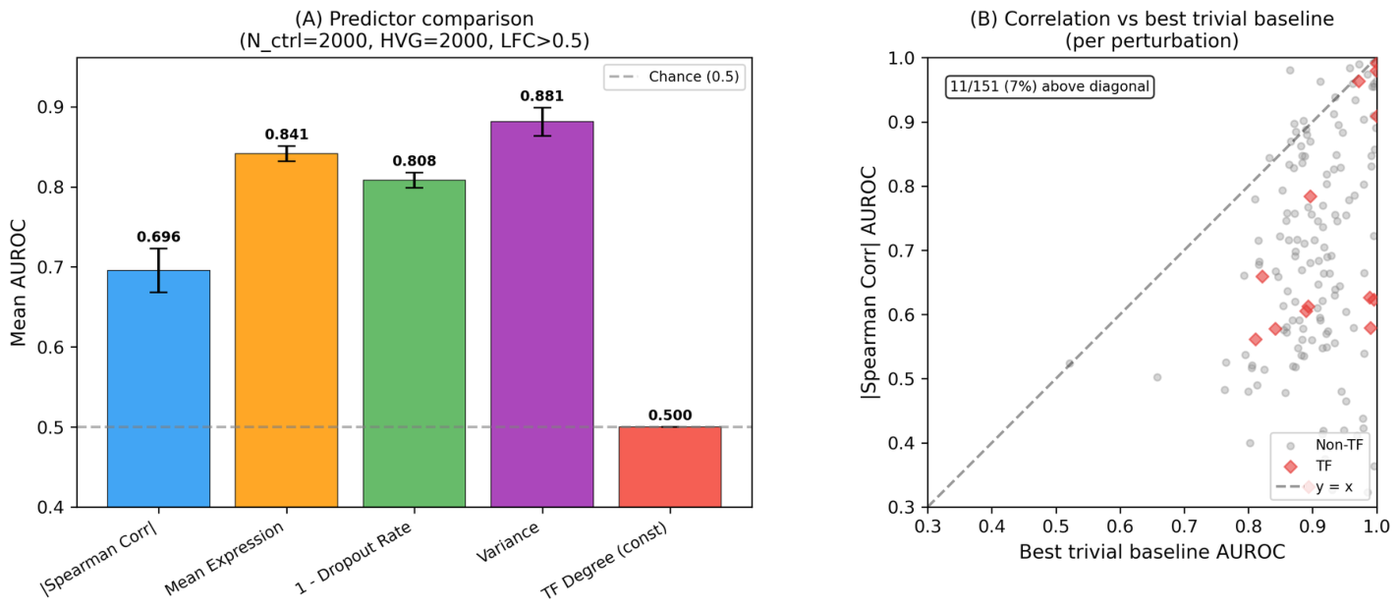 Figure 18: For perturbation-target prediction, gene-level baselines outperform attention-derived pairwise edges. Source: Kendiukhov (BMC Genomics, 2026)
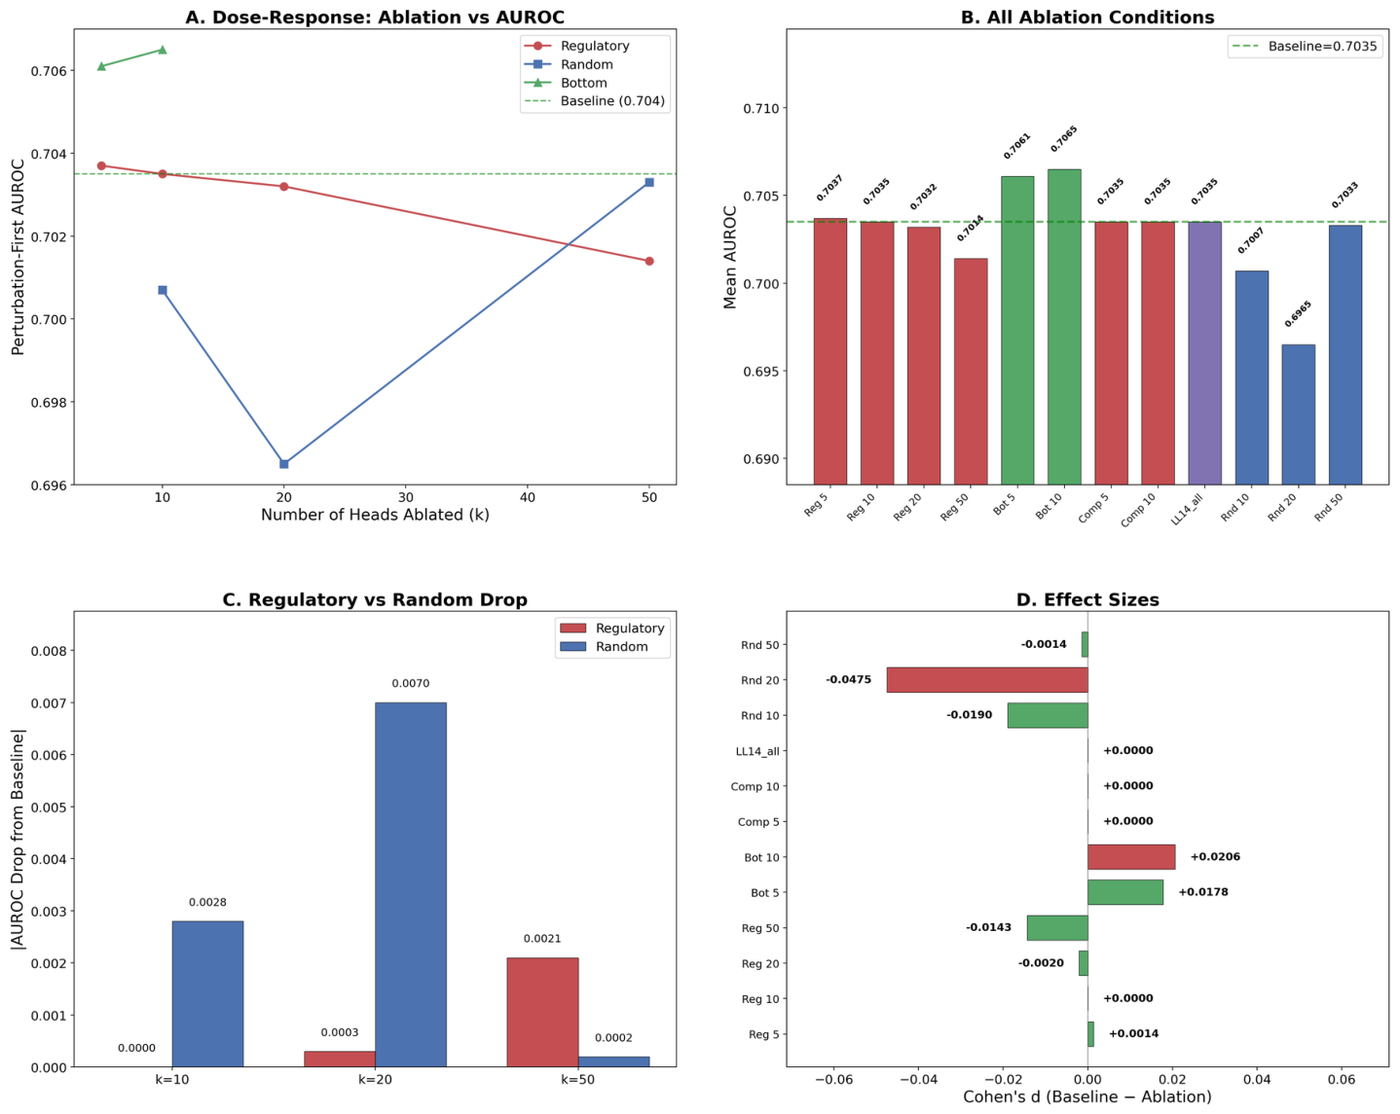 Figure 19: In this perturbation-target test, ablating attention heads identified as regulatory produces no AUROC degradation. Source: Kendiukhov (BMC Genomics, 2026)
The constructive result matters too: Cell-State Stratified Interpretability improved curated gene-regulatory-network recovery by up to 1.85 times in the study's tests.21 The point is not that single-cell models are useless. It is that their attention edges are not validated causal explanations, and their perturbation predictions have not earned a pass over the cheaper linear baseline.213
Multimodal directions
Multimodal biomolecule modelling now takes three useful forms. AlphaFold3 and RoseTTAFold All-Atom combine molecule types in structural predictions.2019 ESM3 links protein sequence, structure, and function. UCE uses protein-language-model embeddings to represent genes across species.22 These are bridges between modalities, not yet a single clinically validated DNA-to-protein-to-expression system. A 2025 systematic review similarly found promising task-level results alongside persistent integration and generalizability gaps in clinical pipelines.23
Where this comparison is unfair
I have argued for a divided verdict: strong benchmark evidence for some variant-effect tasks, weak evidence for perturbation prediction and raw attention-edge interpretation. A skeptical reader should attack that framing, so let me do it first.
The variant-effect claim rests on retrospective benchmarks. Evo 2's BRCA1 result and AlphaGenome's 25-of-26 are real results on their stated evaluations.12 AlphaGenome uses held-out genomic regions, while BRCA1 is scored against saturation-mutagenesis labels; neither paper shows that memorization causes its headline result. They also do not establish prospective clinical utility. In the evidence reviewed for this article, I found no prospective, ancestry-stratified evaluation of a frozen model in a clinical workflow.
The leakage mechanism must be named. Reference-genome exposure does not automatically reveal an experimental variant label, and a held-out genomic interval does not guarantee deployment under population or laboratory shift. Evo 2 uses saturation-mutagenesis labels for BRCA1,1 AlphaGenome evaluates measured functional outcomes,2 and ProteinGym includes expert-annotated clinical labels.15 Each design closes some shortcuts and leaves others open. “Contaminated” is a conclusion to demonstrate, not a synonym for “pretrained.”
The skeptical results are themselves task-specific and could be over-generalized. The Nature Methods negative result is about perturbation prediction; the interpretability critique is about attention-as-regulatory-network; the zero-shot critique is about clustering and integration.3219 None of them shows that single-cell foundation models are worthless for, say, supervised cell-type annotation after finetuning. Using them as a blanket dismissal would be exactly the inverted-hype failure mode this audience distrusts. A reader should weight the single-cell critiques most heavily against single-cell claims.
GENEB's probing protocol understates fine-tuned models, and its instability cuts both ways. GENEB evaluates frozen representations,4 which can make a model built to be fine-tuned look mediocre as a feature extractor. And if leaderboards are unstable and rankings flip by task category, then any single comparison, including the favorable variant-effect ones, is contingent on the task set chosen. The same evidence that lets me discount inflated leaderboard wins also forbids me from over-trusting the wins I happen to like. The category-level view, not the aggregate, is the only defensible one.
Access is not accuracy. AlphaGenome's 25-of-26 result stands on its merits.2 Its downloadable research weights improve reproducibility, but non-commercial terms and H100-class hardware still constrain deployment.13 That is a licensing and validation issue, not evidence that the model is less accurate. The newest model results and GENEB's preprint have also faced less adversarial replication than older structure-prediction work, so confidence should move as replications arrive.
A decision framework for the clinic
The practical consequence of leaderboard instability is that model selection has to be driven by task category, not by a single winner. Here is the decision logic I would apply, expressed as a tree, followed by a matrix. Read both as scope-limited recommendations for evaluation and research, not as endorsements for unsupervised clinical use.
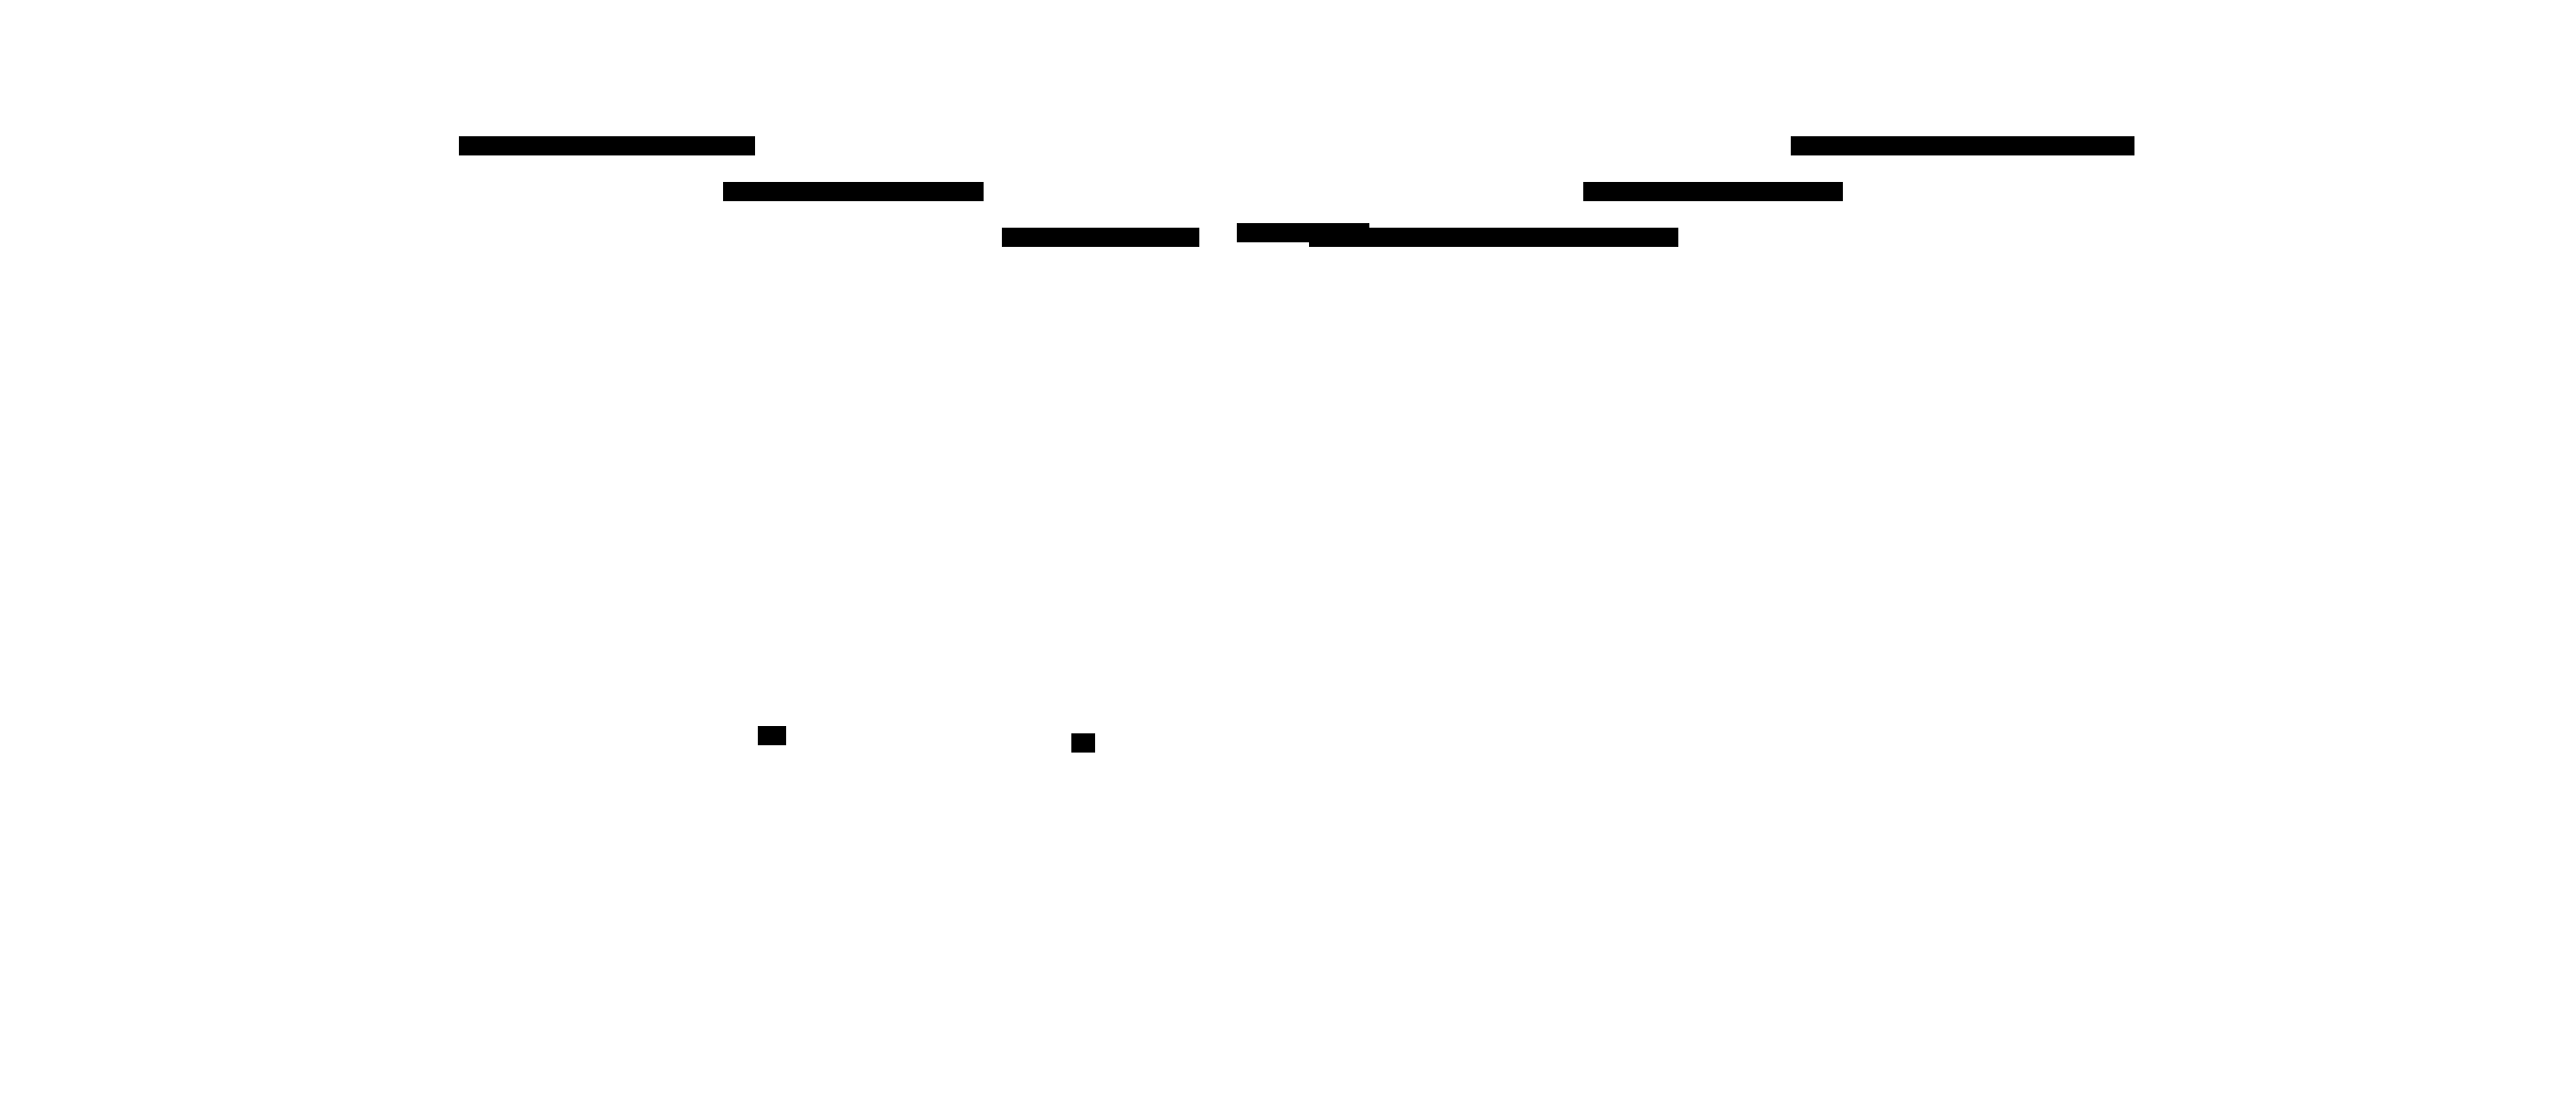 Figure 20: Decision logic for model selection by task category. Recommendations are starting points for evaluation against a baseline, not endorsements for unsupervised clinical use.
The matrix below condenses the same logic. Each row names the honest baseline a model has to beat before you trust it, and the caveat that travels with the recommendation.
| Task | Reasonable first choice in 2026 | Honest baseline to beat first | The caveat that travels with it |
|---|---|---|---|
| Noncoding / splice variant effect | AlphaGenome; Evo 2 | SpliceAI and prior regulatory predictors | Retrospective benchmarks; AlphaGenome weights are downloadable for non-commercial research and require substantial hardware13 |
| Coding SNV pathogenicity | Specialist tools (AlphaMissense, ESM-1b, GPN-MSA) | A calibrated specialist missense tool | Evo 2 ranked 4th/5th on coding SNVs behind these1 |
| Protein missense interpretation | Protein language models on ProteinGym tracks | EVmutation / alignment-based predictors | Relative ranking fluctuates across assays15 |
| Protein structure (accuracy) | AlphaFold2/3 | A specialist where a single interaction dominates | AF3 chirality violations (4.4%), hallucination, weak antibodies19 |
| Protein structure (speed/scale) | ESMFold | AlphaFold2 where accuracy is paramount | 76% monomer / 41% dimer vs 88% / 77% on hard targets18 |
| Multi-molecule complexes / design | RoseTTAFold All-Atom; AlphaFold3 | Specialist docking for single-interaction cases | Generalists underperform specialists per interaction type19 |
| Long-range regulatory, limited compute | Caduceus; HyenaDNA | A well-tuned CNN on Genomic Benchmarks | Caduceus beats 10x larger models8; still benchmark-stage for clinical use |
| Single-cell perturbation prediction | Linear / additive baseline first | The additive / linear baseline (likely wins) | No FM beat simple baselines in any setting tested3 |
| Single-cell zero-shot clustering | HVG + PCA / Harmony / scVI | HVG + PCA, Harmony, scVI | HVG outperformed Geneformer and scGPT across all metrics9 |
| Regulatory network inference from attention | Do not rely on raw attention edges | Gene-level / co-expression baseline | No incremental value for perturbation-target prediction; other GRN-recovery results are more favorable21 |
Table 1: A task-driven selection matrix. Every recommendation is a starting point for evaluation against a baseline on your own data, not an endorsement for unsupervised clinical use.
Two operating principles run through the whole table. Anchor every model to a baseline on your own data before you trust it, because the field's clearest lesson is that baselines win more often than the marketing admits. And prefer version-lockable models for anything approaching a clinical pipeline, because reproducibility under a quality system is not optional. The right first experiment makes both habits concrete: run a frozen model and a trivial baseline on the same split, then estimate the paired performance difference. Non-overlap between two separate confidence intervals is not the right comparison.24
# variant_effect_quickstart.py  (condensed; full tested version in repo)
# The habit that matters: a foundation model only counts if it beats a trivial baseline.
# Pinned: torch==2.5.1  transformers==4.46.3  scikit-learn==1.9.0  biopython==1.87
import numpy as np
from Bio.Align import substitution_matrices
from sklearn.metrics import roc_auc_score

ESM2 = "facebook/esm2_t12_35M_UR50D"
ESM2_REV = "6fbf070e65b0b7291e7bbcd451118c216cff79d8"  # pin the commit, not just the tag

def score_esm2(variants):
    """Zero-shot masked-marginal LLR: log P(wt) - log P(mut). Higher = more damaging."""
    import torch
    from transformers import AutoModelForMaskedLM, AutoTokenizer
    tok = AutoTokenizer.from_pretrained(ESM2, revision=ESM2_REV)
    model = AutoModelForMaskedLM.from_pretrained(ESM2, revision=ESM2_REV).eval()
    out = []
    with torch.no_grad():
        for v in variants:
            ids = tok(v.sequence, return_tensors="pt")["input_ids"].clone()
            i = v.position  # leading <cls> shifts 1-based position to this index
            ids[0, i] = tok.mask_token_id
            lp = torch.log_softmax(model(input_ids=ids).logits[0, i], dim=-1)
            wt, mut = tok.convert_tokens_to_ids(v.wt_aa), tok.convert_tokens_to_ids(v.mut_aa)
            out.append(float(lp[wt] - lp[mut]))
    return np.asarray(out)

def score_blosum62(variants):
    """Trivial baseline: negated BLOSUM62 substitution score. No model, no GPU."""
    b = substitution_matrices.load("BLOSUM62")
    return np.asarray([-float(b[v.wt_aa, v.mut_aa]) for v in variants])

def paired_auroc_difference(labels, model_scores, baseline_scores,
                            n_boot=2000, seed=0):
    """Paired bootstrap CI for model AUROC minus baseline AUROC."""
    rng = np.random.default_rng(seed)
    model_auc = roc_auc_score(labels, model_scores)
    baseline_auc = roc_auc_score(labels, baseline_scores)
    differences = []
    for _ in range(n_boot):
        idx = rng.integers(0, len(labels), len(labels))
        if len(np.unique(labels[idx])) == 2:
            model_boot = roc_auc_score(labels[idx], model_scores[idx])
            baseline_boot = roc_auc_score(labels[idx], baseline_scores[idx])
            differences.append(model_boot - baseline_boot)
    lo, hi = np.percentile(differences, [2.5, 97.5])
    return model_auc, baseline_auc, model_auc - baseline_auc, lo, hi

# variants: a HELD-OUT, ancestry-stratified ClinVar pathogenic-vs-benign split.
# Audit reference exposure, labels, duplicates, and temporal overlap separately. Do not
# call a high AUROC "memorization" without identifying a leakage path.
# result = paired_auroc_difference(
#     labels, score_esm2(variants), score_blosum62(variants)
# )
# Predefine a clinically meaningful margin; pass only if the paired difference CI
# clears that margin. Separate confidence intervals are not a paired test.
# The same harness applies to DNA models
# (Caduceus, Evo 2) by swapping score_esm2 for their per-token log-likelihood API.
# Representative output (illustrative; always judge on your own held-out split).
# Case 1, the model earns further evaluation:
ESM-2 AUROC = 0.93; BLOSUM62 AUROC = 0.82
Paired difference = +0.11  95% CI [+0.06, +0.16]  -> PASS if margin was 0.05
# Case 2, the model adds no demonstrated improvement:
ESM-2 AUROC = 0.84; BLOSUM62 AUROC = 0.83
Paired difference = +0.01  95% CI [-0.04, +0.06]  -> FAIL
What is settled, what is not, and what would change my mind
What the evidence supports today: protein and DNA foundation models deserve task-specific evaluation for variant-effect prediction. Protein-LM missense work has ProteinGym's standardized benchmark,15 while DNA models lead reported noncoding and splicing comparisons but cede coding SNVs to specialists.12 Structure prediction has a well-quantified accuracy-versus-speed frontier between AlphaFold and ESMFold,18 plus broader all-atom models that trade generality against specialist performance.2019 Architecture can outweigh parameter count on a defined task, as Caduceus shows.84
What the evidence does not support: single-cell foundation models over linear baselines for the perturbation settings tested;3 raw attention edges as causal regulatory explanations;21 zero-shot embeddings over simple highly-variable-gene pipelines in the evaluated datasets;9 or any model in this evidence set as a prospectively validated diagnostic. Retrospective AUROC is not prospective clinical utility. Downloadable weights help reproducibility, but they do not solve licensing, hardware, calibration, or clinical-validation requirements.
What would change my mind, and what I would ask the Nature-published colleagues I am sharing a stage with to produce: a prospective, ancestry-stratified evaluation of a frozen, versioned variant-effect model against the specialist tool it claims to beat and a deliberately simple baseline. It should audit reference and label exposure, report concordance with eventual clinical classification rather than retrospective ClinVar discrimination, preregister the protocol, and estimate paired performance differences. Genomics has spent a decade arguing about the ruler.12 The day a model wins on an agreed ruler fairly is the day that corner of the capability ledger earns its place on the validity ledger. Until then: use these models where task-specific evidence is strong, baseline everything, and treat each leaderboard claim as a hypothesis about your data rather than a result on it. The capability curve is steep and real. The validity curve is flatter than the press releases, and that gap is where clinical judgment has to live.
References
Note on scGPT: the scGPT pretraining scale of roughly 33 million non-cancerous human cells is cited here to the zero-shot evaluation source9, where it is reported as part of that study's scale ablation. The primary reference is Cui H, Wang C, Maan H, et al. scGPT: toward building a foundation model for single-cell multi-omics using generative AI. Nature Methods 2024;21:1470-1480. https://www.nature.com/articles/s41592-024-02201-0
Reproducibility note
The central quantitative claims in this article were checked against the cited primary sources during an editorial audit in September 2026. Figures retain source attribution, and captions carrying quantitative claims link to the underlying paper. AlphaGenome's research code and weights are downloadable under non-commercial terms; AlphaFold3 access and other deployment constraints remain relevant to clinical reproducibility. The quickstart pins the model revision, includes a BLOSUM62 baseline, and estimates a paired AUROC difference so readers can test whether any advantage survives on their own held-out data.
This article deliberately does not make three claims that the underlying sources do not support, and a skeptical reader should hold me to their absence:
- No specific numeric BRCA1 accuracy. The verified result is that Evo 2 "set a new state-of-the-art for BRCA1 noncoding SNVs"1 without task-specific finetuning. I do not report any percentage accuracy for that benchmark, because none appears in the verified source text; a figure of that kind circulating in summaries is not traceable to the primary result.
- No ancestry-stratified performance figure. None of the cited papers reports variant-effect performance broken down by genetic ancestry, so I make no claim about how these models perform across non-European populations. That gap is itself a reason for clinical caution.
- No prospective decision-impact metric. Every clinical-sounding number here is retrospective discrimination on curated labels. I make no claim that any model has been shown to change a clinical decision prospectively, because no such study exists in this evidence set.
Revision note
23 September 2026: added a worked reverse-complement example and distinguished Caduceus-PS equivariance from Ph augmentation and bidirectional context. This is a targeted clarification, not a full update of the June article.
Footnotes
-
Brixi G, Durrant MG, Ku J, et al. Genome modelling and design across all domains of life with Evo 2. Nature 2026;652:1349-1361. https://doi.org/10.1038/s41586-026-10176-5 ↩ ↩2 ↩3 ↩4 ↩5 ↩6 ↩7 ↩8 ↩9 ↩10 ↩11 ↩12 ↩13 ↩14 ↩15 ↩16 ↩17 ↩18 ↩19 ↩20
-
Avsec Z, Latysheva NS, Cheng J, et al. Advancing regulatory variant effect prediction with AlphaGenome. Nature 2026;649:1206-1218. https://doi.org/10.1038/s41586-025-10014-0 ↩ ↩2 ↩3 ↩4 ↩5 ↩6 ↩7 ↩8 ↩9 ↩10 ↩11 ↩12 ↩13 ↩14
-
Ahlmann-Eltze C, Huber W, Anders S. Deep-learning-based gene perturbation effect prediction does not yet outperform simple linear baselines. Nature Methods 2025. https://www.nature.com/articles/s41592-025-02772-6 (bioRxiv 2024.09.16.613342; PMC12328236) ↩ ↩2 ↩3 ↩4 ↩5 ↩6 ↩7 ↩8 ↩9 ↩10 ↩11
-
Ledneva D, Nuridinov M, Kuznetsov D. GENEB: Why Genomic Models Are Hard to Compare. arXiv 2026. arXiv:2606.04525. https://arxiv.org/abs/2606.04525 ↩ ↩2 ↩3 ↩4 ↩5 ↩6 ↩7 ↩8 ↩9 ↩10
-
Nguyen E, Poli M, Faizi M, et al. HyenaDNA: Long-Range Genomic Sequence Modeling at Single Nucleotide Resolution. NeurIPS 2023. https://doi.org/10.48550/arXiv.2306.15794 ↩ ↩2 ↩3 ↩4 ↩5
-
Nguyen E, Poli M, Durrant MG, et al. Sequence modeling and design from molecular to genome scale with Evo. Science 2024. https://arcinstitute.org/manuscripts/Evo.pdf ↩ ↩2
-
Zhou Z, Ji Y, Li W, Dutta P, Davuluri RV, Liu H. DNABERT-2: Efficient Foundation Model and Benchmark for Multi-Species Genomes. ICLR 2024. https://doi.org/10.48550/arXiv.2306.15006 ↩ ↩2 ↩3 ↩4
-
Schiff Y, Kao C-H, Gokaslan A, Dao T, Gu A, Kuleshov V. Caduceus: Bi-Directional Equivariant Long-Range DNA Sequence Modeling. ICML 2024. https://doi.org/10.48550/arXiv.2403.03234 ↩ ↩2 ↩3 ↩4 ↩5 ↩6 ↩7
-
Kedzierska KZ, et al. Zero-shot evaluation reveals limitations of single-cell foundation models. Genome Biology 2025. PMC12007350. https://pmc.ncbi.nlm.nih.gov/articles/PMC12007350/ ↩ ↩2 ↩3 ↩4 ↩5 ↩6 ↩7 ↩8 ↩9 ↩10 ↩11
-
Marin FI, Teufel F, Horlacher M, et al. BEND: Benchmarking DNA Language Models on Biologically Meaningful Tasks. ICLR 2024. arXiv:2311.12570. https://arxiv.org/abs/2311.12570 ↩ ↩2 ↩3
-
OmniGenBench: Automating Large-scale in-silico Benchmarking for Genomic Foundation Models. arXiv 2024. arXiv:2410.01784. https://arxiv.org/abs/2410.01784 ↩
-
Gresova K, Martinek V, Cechak D, Simecek P, Alexiou P. Genomic benchmarks: a collection of datasets for genomic sequence classification. BMC Genomic Data 2023;24:25. PMC10150520. https://pmc.ncbi.nlm.nih.gov/articles/PMC10150520/ ↩ ↩2 ↩3
-
Google DeepMind. AlphaGenome Research: code and pretrained model weights. 2026. https://github.com/google-deepmind/alphagenome_research ↩ ↩2 ↩3 ↩4
-
Fishman V, Kuratov Y, et al. GENA-LM: a family of open-source foundational DNA language models for long sequences. Nucleic Acids Research 2025;53(2):gkae1310. https://academic.oup.com/nar/article/53/2/gkae1310/7954523 ↩
-
Notin P, Kollasch A, Ritter D, et al. ProteinGym: Large-Scale Benchmarks for Protein Fitness Prediction and Design. NeurIPS 2023. https://doi.org/10.52202/075280-2810 ↩ ↩2 ↩3 ↩4 ↩5 ↩6 ↩7
-
Bergquist T, Stenton SL, Nadeau EAW, et al. Calibration of additional computational tools expands ClinGen recommendation options for variant classification with PP3/BP4 criteria. Genetics in Medicine 2025;27(6):101402. https://doi.org/10.1016/j.gim.2025.101402 ↩
-
Lin Z, Akin H, Rao R, Hie B, et al. Evolutionary-scale prediction of atomic-level protein structure with a language model. Science 2023;379:1123-1130. https://www.science.org/doi/10.1126/science.ade2574 ↩ ↩2 ↩3 ↩4 ↩5
-
Mahtha SK, Venkadesan S, Mohanty D. Comparative evaluation of the prediction accuracy of AlphaFold and ESMFold for monomeric and dimeric proteins. NAR Genomics and Bioinformatics 2026;8:lqag002. https://doi.org/10.1093/nargab/lqag002 ↩ ↩2 ↩3 ↩4 ↩5
-
Abramson J, Adler J, Dunger J, et al. Accurate structure prediction of biomolecular interactions with AlphaFold 3. Nature 2024;630:493-500. https://www.nature.com/articles/s41586-024-07487-w (PMC11168924) ↩ ↩2 ↩3 ↩4 ↩5 ↩6 ↩7 ↩8 ↩9 ↩10 ↩11
-
Krishna R, Wang J, Ahern W, et al. Generalized biomolecular modeling and design with RoseTTAFold All-Atom. Science 2024;384:eadl2528. https://www.science.org/doi/10.1126/science.adl2528 ↩ ↩2 ↩3 ↩4 ↩5 ↩6
-
Kendiukhov I. Systematic evaluation of single-cell foundation model interpretability: attention-derived edge scores add no incremental value over gene-level features for perturbation-target prediction. BMC Genomics 2026;27. https://doi.org/10.1186/s12864-026-12965-8 ↩ ↩2 ↩3 ↩4 ↩5 ↩6 ↩7 ↩8 ↩9
-
Rosen Y, Roohani Y, Agarwal A, et al. Universal Cell Embeddings: A Foundation Model for Cell Biology. bioRxiv 2023. https://www.biorxiv.org/content/10.1101/2023.11.28.568918 ↩ ↩2 ↩3
-
A systematic review on the generative AI applications in human medical genetics. Frontiers in Genetics 2025. PMC12863965. https://pmc.ncbi.nlm.nih.gov/articles/PMC12863965/ ↩
-
Greenland S, Senn SJ, Rothman KJ, et al. Statistical tests, P values, confidence intervals, and power: a guide to misinterpretations. European Journal of Epidemiology 2016;31:337-350. https://doi.org/10.1007/s10654-016-0149-3 ↩
Help improve this article
Found an error or a better source? Leave a note here, or highlight a passage to comment on it.