In its developers' comparisons, SpliceAI2 scored above SpliceAI, Pangolin and AlphaGenome on every benchmark printed in the paper. That includes the closest test to clinical use: cryptic splicing created by rare variants in Genomics England blood RNA-seq. Every value is developer-reported, most test variants lie in genes the model saw in training, no uncertainty is printed, and the data are controlled access. Motif scoring, the baseline for both splicing use cases, was not compared.
Evidence tables: every SpliceAI2 comparison in this article, with the evaluated configuration and source locator for each value, is in the Rewire benchmark database on two use-case pages: Inherited-disorder patient-RNA splicing validation and Prioritise variants for splicing experiments.
SpliceAI2 is Illumina's successor to SpliceAI, released with a bioRxiv preprint by Kishore Jaganathan, Kyle Farh and colleagues, an announcement and code on GitHub. I did not rerun it. The values below are transcribed from the preprint and are awaiting independent review in the benchmark database.
The use cases and their baseline
The Rewire benchmark database maps this paper to two use cases.
Patient-RNA splicing validation. For a patient with a suspected inherited disorder, a diagnostic lab decides which variants are likely to change splicing, then tests them in RNA from blood, fibroblasts or muscle. The question is which DNA and RNA evidence identifies a splice-altering variant. A separate review covers the other published comparisons for this use case.
Splicing follow-up. A lab chooses which human variants to test in a splicing experiment, such as a minigene reporter. The question is which score best ranks variants for that experiment. A separate post covers the MFASS reporter evidence.
For predicting splicing from DNA, the baseline in both use cases is motif scoring of splice sites: MaxEntScan, GeneSplicer and position weight matrices. These score the few dozen bases around a donor or acceptor and were standard before deep learning. A newer predictor beats the baseline only if it scores better against the same truth on the same variants.
The SpliceAI2 paper does not include a motif-scoring method. All its comparisons are between machine-learning models, so it says nothing about how far SpliceAI2 is ahead of the baseline. The database records this as a gap in both use cases (issue #121).
Model families in the paper
| Family | Models in the paper | What they predict | Run by |
|---|---|---|---|
| Motif scoring (baseline) | None | Change in a short splice-site motif score | Not compared |
| Deep sequence models | SpliceAI, Pangolin | Whether each position is a splice site (SpliceAI); site usage across tissues and species (Pangolin) | SpliceAI2 authors, except OpenSplice (scores released with that dataset) |
| Sequence-to-function model | AlphaGenome | Many genomic tracks, including splice sites and junctions | Co-authors at the University of Oxford |
| Usage, junction and transcript model | SpliceAI2 | Site usage, junction usage and complete transcripts | SpliceAI2 authors |
SpliceAI2 is a deep sequence model like SpliceAI. Like Pangolin, it is trained on how often sites are used, and it adds junctions and transcripts. AlphaGenome was scored in several ways. The paper's chosen AlphaGenome score is a raw composite splice score; a raw splice site score is also reported for two benchmarks and gives different values, shown separately below.
How SpliceAI2 works

Simplified from the SpliceAI2 paper, Fig. 1a and Extended Data Fig. 1. Diagram by the author.
The input is 196,608 bp of sense-strand DNA and a label for one of ten mammalian species. Each model has about 13 million trainable parameters, and the released predictor averages two models trained with the same settings. A convolutional trunk produces features for each base. Splice site heads predict donor and acceptor usage. The highest-scoring sites are then paired with attention to predict junction usage. Sites and junctions form a splice graph, and each transcript is a path through it.
Site and junction labels come from 314,745 short-read RNA-seq samples in ten species. Transcript labels come from 330 long-read samples in human and mouse. The human short-read samples are 127,431 recount3 samples, which include GTEx.
A variant is scored by running the reference and variant sequences and taking the largest change in donor or acceptor gain or loss. All the comparisons below exclude essential splice variants, so they do not cover the canonical GT and AG dinucleotides.
Who ran the comparisons, and on what data
Four points apply to every value in this article.
- Developer-reported. The SpliceAI2 authors at Illumina built every benchmark, chose the comparator settings and ran SpliceAI, Pangolin and SpliceAI2. AlphaGenome was run by co-authors at the University of Oxford. The paper is a preprint and has not been peer reviewed.
- Training overlap. Genes on chromosomes 21 and 22 were held out; all other human genes were used for training. The variant benchmarks are genome-wide, so most test variants lie in genes whose reference splicing SpliceAI2 was trained on. GTEx RNA-seq is among the training data, and the paper does not say whether junctions in the GTEx benchmark samples were removed. The comparators were trained on other data, so this may favour SpliceAI2.
- Controlled access. The GTEx, Genomics England and UK Biobank data need approved access, and the derived variant lists are not released. The comparisons cannot be rerun from public data.
- No uncertainty. No confidence interval or resampling estimate is printed for any comparison.
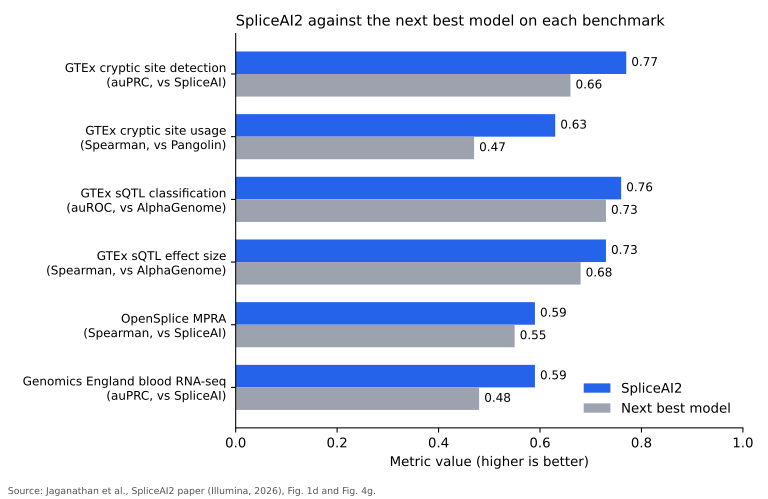
SpliceAI2 and the next best of SpliceAI, Pangolin and AlphaGenome on each benchmark, all variants, developer-reported. Values from Extended Data Fig. 2 and Fig. 4g of the preprint. No uncertainty is printed.
Patient RNA: cryptic splicing in Genomics England blood RNA-seq
The authors used 5,435 rare-disease participants from the Genomics England 100,000 Genomes Project with genome sequencing and blood RNA-seq. They took rare variants that create a GT or AG dinucleotide and labelled 3,065 as cryptic gains, where the participant's RNA showed a new junction at the created site, and 1,775,800 as nulls. Each model ranked the same variants.
| Model | auPRC |
|---|---|
| SpliceAI2 | 0.59 |
| SpliceAI | 0.48 |
| AlphaGenome, raw splice site score | 0.45 |
| Pangolin | 0.40 |
| AlphaGenome, raw composite score (paper's choice) | 0.36 |
Jaganathan et al. 2026 (preprint), Fig. 4g and Methods. Developer-reported; no uncertainty printed.
This is the comparison closest to the patient-RNA use case: four DNA predictors scored against splicing seen in rare-disease patients' own RNA. The database grades it as proxy evidence, as it does the Drost et al. comparison in the patient-RNA review. The predictors take DNA, not patient RNA, and the endpoint covers only one variant class, cryptic sites created by a new GT or AG. Blood RNA only shows splicing in genes expressed in blood, so some nulls may splice abnormally in other tissues.
The authors also ran SpliceAI2 as a prioritisation step. In participants with monoallelic disorders, 23 rare variants in phenotype-matched panel genes scored above 0.25, and 17 of them showed the predicted splicing change in the participant's RNA-seq. No other model was put through this step, so 17 of 23 is not a comparison. Confirmation was judged from sashimi plots against 20 pooled controls; the paper gives no numeric rule for it. A splicing change is not a diagnosis.
Splicing experiments: the OpenSplice reporter assay
OpenSplice is a massively parallel reporter assay from another group that measured the change in exon inclusion for 283,121 single-nucleotide substitutions across 599 human exons. The SpliceAI2 authors compared Spearman correlations between predicted and measured change.
| Model | All substitutions | Exonic | Intronic |
|---|---|---|---|
| SpliceAI2 | 0.59 | 0.62 | 0.52 |
| SpliceAI | 0.55 | 0.57 | 0.50 |
| Pangolin | 0.53 | 0.54 | 0.49 |
| AlphaGenome | 0.49 | 0.52 | 0.44 |
Jaganathan et al. 2026 (preprint), Extended Data Fig. 2. Spearman correlation, developer-reported; no uncertainty printed.
The comparator scores are those released with OpenSplice, while SpliceAI2 was scored by its developers with their own exon-skipping formula, so the settings differ between models. The Methods also say the AlphaGenome score was chosen as best on average across eight evaluations, which may include this one. This is a rank correlation over every substitution. The splicing follow-up use case asks a narrower question, how many true splice-disrupting variants a score puts in the first few that a lab can test, and this benchmark does not answer it. The database grades it as proxy evidence for that use case.
GTEx benchmarks
The two GTEx benchmarks use healthy-tissue RNA-seq from the same project that contributed training data. The database records them but does not map them to either use case.
Cryptic splice sites. 4,545 rare variants that create a GT or AG and activate a cryptic site in GTEx RNA-seq, against 573,967 that do not. Detection is auPRC; usage is the Spearman correlation between predicted and observed use of the new site among the 4,545.
| Model | Detection, all | Detection, deep intronic | Usage, all | Usage, deep intronic |
|---|---|---|---|---|
| SpliceAI2 | 0.77 | 0.68 | 0.63 | 0.54 |
| SpliceAI | 0.66 | 0.52 | 0.45 | 0.36 |
| Pangolin | 0.56 | 0.44 | 0.47 | 0.35 |
| AlphaGenome | 0.54 | 0.45 | 0.41 | 0.31 |
Jaganathan et al. 2026 (preprint), Extended Data Fig. 2. Deep intronic means 500 bp or more from the nearest exon. Developer-reported; no uncertainty printed.
With its raw splice site score, AlphaGenome's detection auPRC was 0.63 rather than 0.54. The paper does not print how many variants fall in each region.
Splicing QTLs. 2,385 fine-mapped GTEx sQTL variants against 3,824 variants with fine-mapping probability below 0.1 in every tissue. Classification is auROC; effect size is the Spearman correlation with the fine-mapped variants' average effect across tissues.
| Model | Classification (auROC) | Effect size (Spearman) |
|---|---|---|
| SpliceAI2 | 0.76 | 0.73 |
| AlphaGenome | 0.73 | 0.68 |
| SpliceAI | 0.71 | 0.65 |
| Pangolin | 0.70 | 0.66 |
Jaganathan et al. 2026 (preprint), Extended Data Fig. 2, all variants. Developer-reported; no uncertainty printed.
The largest margins over the next best model are in predicting how much a site is used (0.63 against 0.47) and in deep intronic detection (0.68 against 0.52). The sQTL margins are smaller, 0.03 to 0.05.
Population and protein evidence
Two analyses test scores against signals that do not come from RNA-seq. Both are indirect, and neither is mapped to a use case.
Across more than 627,000 genomes from gnomAD, TOPMed and UK Biobank, the authors correlated each splice-proximal variant's score with how often it is seen. In genes intolerant of loss of function, the Spearman correlation was -0.122 for SpliceAI2, -0.110 for Pangolin, -0.105 for AlphaGenome and -0.096 for SpliceAI. More negative means high-scoring variants are rarer, which is what selection against damaging variants would produce.
In 36,764 UK Biobank participants with plasma proteomics, 6,149 rare splice-region variants in 1,656 genes were compared with carriers' protein levels. The Pearson correlation was -0.504 for SpliceAI2, -0.481 for AlphaGenome, -0.475 for Pangolin and -0.463 for SpliceAI. More negative means a higher score goes with lower protein.
In 7,504 probands from the 100,000 Genomes Project with dominant-disorder gene panels, the authors counted variants prioritised by each model that fall in the proband's panel genes, beyond what phenotype-shuffled controls give. At the threshold where this enrichment reaches an odds ratio of 2, SpliceAI2 found 133 excess variants. The comparator curves are not labelled, and the paper names no other model's value. The authors report that about half of the cryptic splice variants SpliceAI2 found in this analysis lie more than 50 bp into introns, outside what exome sequencing usually covers.
Tissue and disease fine-tunes
A fine-tuned version takes the expression of 147 RNA-binding proteins as a tissue signature. On held-out chromosomes across 48 GTEx tissues, it predicted differences in junction usage between tissue pairs with Pearson r 0.44 over all pairs, 0.58 for cerebellum against blood and 0.51 for cortex against testis. The same approach, fine-tuned on uveal melanoma with and without SF3B1 mutations, gave r 0.49 on a filtered set of junctions. Fine-tuned on muscle from people with myotonic dystrophy, it gave a mean r of 0.26 across disease-severity groups.
These predict differences in reference splicing between conditions, not variant effects. For variants whose effect differs by tissue, the authors found no benefit from the tissue-specific predictions beyond measured reference splicing in each tissue.
Access and licence
The code, the two-model weights and precomputed scores are released under the SpliceAI2 Model Terms of Use. These allow use only by or for non-commercial organisations and exclude for-profit companies, contract research organisations and commercial healthcare providers or laboratories. Redistribution and hosting are not allowed. The software is labelled for research use only, not for diagnostic procedures. Precomputed scores are also offered through Illumina's DRAGEN annotation. The paper does not say whether the evaluated ensemble is the same as the released checkpoints.
What has not been measured
- No independent evaluation of SpliceAI2 exists yet. It was released on 8 October 2026.
- No comparison with motif scoring, the baseline for both use cases.
- No uncertainty for any comparison.
- No test restricted to genes held out from training, apart from transcript reconstruction on chromosomes 21 and 22.
- No other model was put through the Genomics England prioritisation and RNA-seq confirmation step.
- No measure of how many true splice-disrupting variants each score puts among the first few a lab can test, the splicing follow-up endpoint.
- The Genomics England figure of validation rate by SpliceAI2 score, over 41,959 variant-gene pairs, has no printed values.
- No comparison with tissue-aware predictors such as AbSplice on patient RNA.
Per-model values, configurations and source locators for every comparison above are on the patient-RNA splicing validation and splicing follow-up use-case pages.
Help improve this article
Found an error or a better source? Leave a note here, or highlight a passage to comment on it.