A single-cell RNA sequencing study measures gene activity in each of thousands of individual cells. To make sense of the data, researchers first need to know what type each cell is, such as a B cell, a CD8 T cell or a monocyte. Giving each cell a cell-type label is called annotation.
Annotating cells by hand is slow and relies on expert judgement. A common alternative uses a reference: earlier studies whose cells already carry labels. A computer method learns from the reference and then proposes a label for each cell in the new study. This approach is called label transfer.
Anyone labelling a new study this way faces two questions:
- Which method should assign the labels?
- How do you decide when a proposed label is reliable enough to keep? Most methods give each label a confidence score, and cells scoring below a chosen threshold can be left unassigned.
Rewire Bio, which also publishes rewire.it, ran a recorded computational benchmark on both questions for blood samples. The benchmark has not been peer reviewed. The methods learned from six existing blood studies. They were then tested on four other blood studies, from 32 donors in total. None of the test studies' cells were used for training.
The findings in brief
- Choosing a method. Four of the six methods trained on the study's reference agreed with the original authors' labels at almost the same level. The study could not establish a clear difference among them, but it also did not show that they are equivalent. Two simpler methods agreed less.
- Choosing a threshold. Thresholds chosen on other studies did not reliably carry over to the test studies. According to the paper, how often accepted labels were wrong depended more on which test study was being labelled than on the choice among those four methods.
- Missing cell types. When three cell types were removed from the reference, the methods still accepted a label from the reference for most cells of those types. Across all cells of those types, the most common label was usually a closely related type.
The study's paper, source at revision fd4588c, release page and evidence archive are public.
How the benchmark was set up
Reference and test studies
The reference was six blood studies from CELLxGENE Census, a public collection of single-cell data. Four test studies were kept entirely out of training, so the methods never saw any of their cells. The test studies were the Human Immune Health Atlas (HIHA) and studies of rheumatoid arthritis (RA), glaucoma and juvenile dermatomyositis (JDM).
Only cells that the Census records as healthy (disease == 'normal') were used. The RA, glaucoma and JDM studies therefore contributed only their cells labelled healthy.
The test cells came from two sources. One was a main sample of each study's cells. The other was extra cells of rare types, added so that those types had enough cells to measure.
What counted as correct
The benchmark measured accuracy as agreement with author labels: the cell-type labels that each test study's own authors had assigned. These labels were mapped to 14 shared classes using the Cell Ontology, a standard vocabulary of cell types. The benchmark did not independently adjudicate whether the author labels were right, so they serve as comparison labels rather than verified truth.
The methods compared
Six methods learned from exactly the same reference cells and genes:
- M1, a marker rule: scores each class by its top-ranked marker genes in the reference.
- M2, nearest centroid: picks the class whose average cell is closest.
- M3, k-nearest neighbours (kNN): takes a vote among the most similar reference cells.
- M4, multinomial logistic regression: a linear classifier.
- M5, CellTypist trained on this reference: a logistic-regression annotation tool.
- M6, scANVI: a deep generative model.
The study also ran two ready-made models exactly as their developers released them: CellTypist Immune_All_Low v2 (P1) and a scTab checkpoint (P2). These released models differ from M1 to M6 in their training data, in their sets of cell-type names and in how those names were mapped to the study's classes.
Thresholds, coverage and error
Each method gives a confidence score for the label it proposes. If the score falls below a threshold, the cell is left unassigned. Two measures follow:
- Coverage is the share of cells that receive a label.
- Accepted error is the share of labelled cells whose label disagrees with the author label.
Thresholds were chosen on two validation studies, separate from the four test studies, and then applied unchanged to the test studies. The study used two rules:
- The coverage threshold (OP-cov) labelled 90% of validation cells.
- The error threshold (OP-err) was the lowest threshold that kept accepted error on validation cells at 5% or less.
Removing cell types from the reference
The main experiment (Arm A) used the full reference. In a second experiment (Arm B), every plasmacytoid dendritic cell (pDC), antibody-secreting cell (ASC) and mucosal-associated invariant T (MAIT) cell was removed from the reference before the methods were retrained. Test cells of those three types could then receive only a wrong label or no label.
Uncertainty
Numbers in square brackets are 95% intervals. They come from resampling donors 1,000 times within the four test studies. The intervals describe uncertainty across donors in these four studies only. They say nothing about how results would vary in new studies.
Choosing a method: no clear difference among four learned methods
The main accuracy score was macro-F1. For this score, every cell received the method's top label, with no threshold applied. For each cell type, F1 balances two kinds of mistake: cells of that type that were missed, and other cells wrongly given that type. Macro-F1 then averages F1 across cell types, so rare types count as much as common ones. The average covered the 11 classes with at least 20 test cells in the main sample. A score of 1 would mean perfect agreement with the author labels.
Four methods scored almost the same. Logistic regression scored 0.694 [0.669, 0.716], kNN and scANVI 0.692, and CellTypist trained on the reference 0.689.
The study compared each of the other three with logistic regression by taking the difference in scores. Every one of these differences had an interval that included zero. For CellTypist trained on the reference, for example, the difference was −0.005 [−0.013, 0.003].
An interval that includes zero means the data are consistent with no difference. The same data are also consistent with small differences in either direction. The study did not set an equivalence margin in advance, meaning a difference small enough to count as practically the same. The results therefore do not show that the four methods are equivalent. They show only that this benchmark could not establish a clear difference among them.
Two methods agreed less with the author labels. Nearest centroid scored 0.629 (difference −0.066 [−0.077, −0.053]) and the marker rule 0.497 (difference −0.197 [−0.213, −0.179]).
Compared with logistic regression trained on the reference, released CellTypist (P1) scored 0.617 (difference −0.077 [−0.094, −0.060]). Released scTab (P2) scored 0.684 (difference −0.010 [−0.023, 0.003]), an interval that includes zero. The released models differ in training data, cell-type names and label mapping, so these comparisons cannot show whether model design explains any gap.
Error depended more on the test study than on the method
At the coverage threshold, logistic regression's accepted error ranged from 2.1% in HIHA to 17.9% in RA. Table 1 shows the result for each test study.
| Test study | Test donors | Coverage | Accepted error |
|---|---|---|---|
| HIHA | 12 | 0.940 | 0.021 |
| JDM | 5 | 0.906 | 0.056 |
| Glaucoma | 3 | 0.847 | 0.144 |
| RA | 12 | 0.651 | 0.179 |
| All four, pooled | 32 | 0.817 [0.776, 0.855] | 0.087 [0.078, 0.096] |
Table 1. Logistic regression (M4) at the coverage threshold (OP-cov), for each test study and pooled across all four. Coverage is accepted cells divided by scorable cells. Accepted error is wrong accepted cells divided by accepted cells. Per-study values are single estimates without intervals. The pooled row has 95% donor-bootstrap intervals within the four studies. Source: study paper, section 3.1 and Table 2.
The other learned methods stayed close to logistic regression. kNN, CellTypist trained on the reference and scANVI differed from logistic regression by 0.036 or less in pooled accepted error at the coverage threshold.
From these results, the paper concludes that the test study mattered more for accepted error than the choice among these four methods. That conclusion does not cover the marker rule or nearest centroid. It also rests on only four studies, with no interval describing how much results vary from study to study.
HIHA needs one extra caution. Its authors report that CellTypist Immune_All models and Seurat label transfer guided their expert annotation (Gong et al., 2025). Agreement with HIHA labels therefore partly measures similarity to that labelling pipeline. On HIHA, released CellTypist's macro-F1 (0.842) was below logistic regression's (0.942).
Choosing a threshold: validation settings did not reliably carry over
Neither threshold rule consistently met its validation target on the test studies.
The coverage threshold was set to label 90% of validation cells. Pooled over the four test studies, no method reached 90% coverage at that threshold. For the six methods trained on the full reference, coverage ranged from 79.8% (CellTypist trained on the reference) to 88.6% (kNN). Single studies could exceed 90%: logistic regression covered 94.0% of HIHA and 90.6% of JDM.
The error threshold was set for 5% accepted error on validation cells. On the test studies, it gave accepted errors from 0 to 16%, while labelling very different shares of cells. Logistic regression labelled only 4.4% of cells, with no accepted errors. Nearest centroid labelled 41.6% of cells, with 3.2% accepted error.
Two methods had no error threshold at all. kNN and scANVI never reached 5% accepted error on the validation studies.
For logistic regression and CellTypist trained on the reference, the error threshold sat almost exactly at 1, the top of the confidence scale (0.9999998 for CellTypist). A threshold that extreme accepts only near-certain scores, so those two results are close to a trivial edge case.
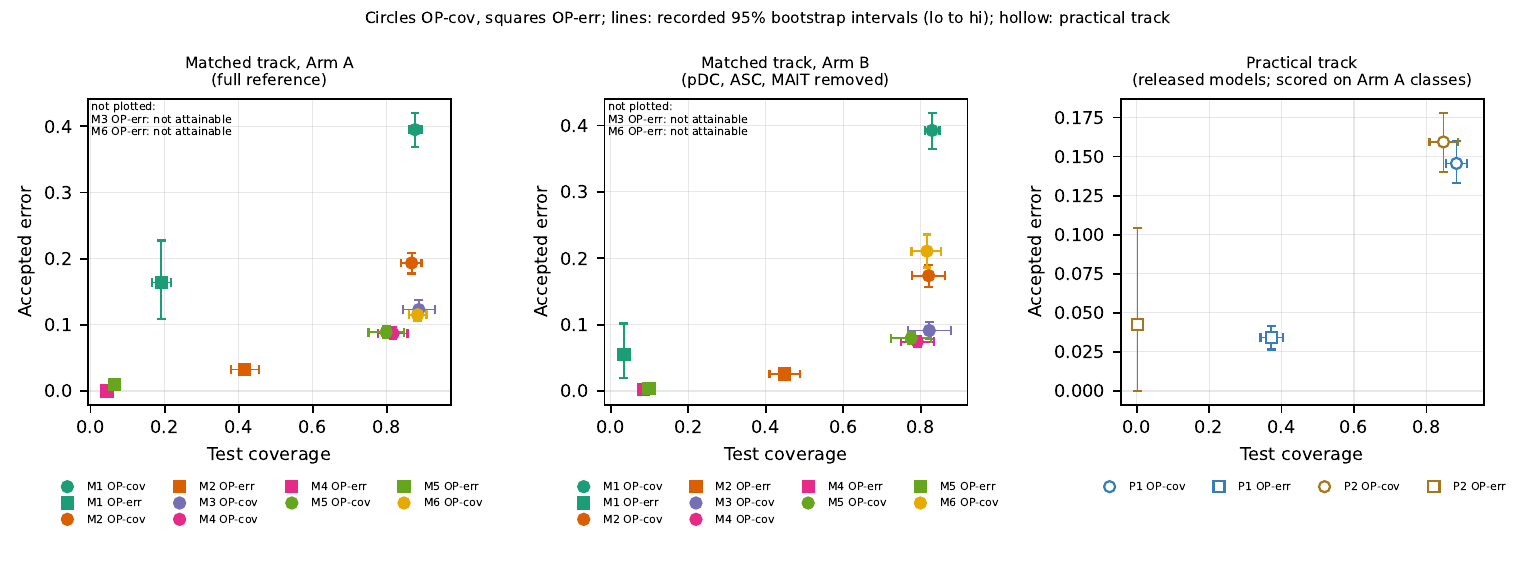
Figure 1. Accepted error against test coverage at the two thresholds chosen on validation studies. The horizontal axis is coverage (further right labels more cells); the vertical axis is accepted error (lower is better). Circles show the coverage threshold (OP-cov) and squares the error threshold (OP-err). Left panel: the six methods trained on the full reference (Arm A). Middle panel: the same methods retrained with pDC, ASC and MAIT removed (Arm B). Right panel: the released models P1 and P2 (hollow markers). Lines are recorded 95% donor-bootstrap intervals within the four test studies; they do not describe variation across new studies. M3 and M6 have no OP-err point. Figure 1 from the study paper (Rewire Bio, 2026), revision fd4588c.
Missing cell types still received labels from the reference
A method cannot give the correct label to a cell type that is absent from its reference. Ideally, such cells would receive low confidence and stay unassigned. In Arm B, at the coverage threshold, most of them were labelled anyway.
Arm B had 2,310 test cells of the three removed types, mostly from the extra rare-cell sample. At the coverage threshold, the retrained methods accepted a label from the reference for 65.9% (logistic regression) to 89.2% (kNN) of these cells. Every one of those accepted labels is wrong, because the correct type was no longer in the reference.
A separate count looked at all cells of each removed type, whether accepted or left unassigned. This count is a different measurement from the acceptance rates above. The most frequent predicted label was usually a close relative:
- ASCs were most often labelled B cells.
- MAIT cells were most often labelled γδ T or CD8 T cells.
- pDCs were most often labelled conventional dendritic cells (cDC) by the marker rule, kNN and logistic regression.
The study also asked whether confidence scores ranked cells of known types above cells of removed types. It measured this with AUROC, where 0.5 means no separation and 1 means perfect separation. AUROC ranged from 0.441 to 0.650. Values for kNN, scANVI and CellTypist trained on the reference were below 0.5. These AUROC values have no interval.
The study interprets these results as showing that thresholds tuned to label 90% of validation cells failed to flag these near-neighbour types, meaning types closely related to types still in the reference, as unfamiliar. Distant or genuinely new cell types were not tested. Earlier work also found that options for rejecting uncertain cells can fail when a whole population is missing from the reference (Abdelaal et al., 2019).
Suggestions for a new study
These are my suggestions; none was tested.
- Start with a simple learned classifier, such as logistic regression, trained on a reference similar to your own cohort.
- Treat a pooled error rate as a loose guide to the error on your own study.
- If part of your study already has labels, re-check the threshold's coverage and accepted error on that subset, as the paper recommends.
- Do not rely on confidence to flag cell types missing from the reference. Compare the reference's classes with the types you expect.
- Look at the unassigned cells. They include both low-quality cells and cells with low confidence. In the output of the released model below,
decisionandreasonseparate the two,second_labelgives the runner-up label,marker_flagmarks weak support from marker genes, andtotal_countsandgenes_detectedshow cell quality.
Run the released model
The study provides its logistic regression model (M4) and a command-line annotator. The commands below download the code at revision fd4588c, check file hashes, build the locked software environment and label 12 example cells at the coverage threshold (OP-cov, threshold 0.7018). The commands need git, curl, make, shasum, uv and Python 3.11.13. The recorded outputs come from macOS on Apple Silicon.
mkdir celltransfer-demo && cd celltransfer-demo
git clone https://github.com/rewire-bio/cell-type-annotation-transfer.git study
git -C study checkout --detach fd4588c2b58eee214fea76b1874be1a37df1f0da
curl --fail --location --output m4-example.tar.gz \
  https://github.com/rewire-bio/cell-type-annotation-transfer/releases/download/study-v1-seed0-20261007/m4-example.tar.gz
echo "7b798df27f35440f5c2c01ab1f39f284896a31fb5229dd342393d914cd1cdf78  m4-example.tar.gz" | shasum -a 256 -c -
tar -xzf m4-example.tar.gz
(cd m4-bundle && shasum -a 256 -c SHA256SUMS)
(cd study && make env)
PYTHONPATH=study/companion/src study/.venv/bin/python -m celltransfer.cli annotate \
  --bundle m4-bundle --query example/blood12.h5ad \
  --operating-point coverage90 --out predictions.csv
The query, meaning the new data to be labelled, needs raw non-negative integer counts in .X (or --layer counts or --use-raw), unique cell IDs, Ensembl gene IDs and all genes. All genes are needed because library size is calculated from the full matrix. The output file predictions.csv has one row per cell, with these columns: cell_id, predicted_label, confidence, decision, reason, operating_point, threshold, second_label, second_confidence, marker_support_z, marker_flag, total_counts and genes_detected.
The 12 cells are the first rows of the RA test query (Binvignat et al., 2024). In the recorded output, every gene the model uses was present. All 12 cells were left unassigned with reason low_counts_or_genes. The cells had 144 to 236 counts and 129 to 169 detected genes, below the default quality screen of 500 counts and 200 genes.
The example therefore checks that the parts of the tool work together (model loading, input checks, output columns). The example gives no accuracy estimate. Keep the default quality screen on real data.
The commands were checked against the code at revision fd4588c and the recorded outputs but not run for this article. A fresh public clone has not yet been tested.
Limits of this evidence
- The benchmark did not independently adjudicate the author labels. HIHA's labels were partly guided by CellTypist and Seurat, so agreement with HIHA is partly circular.
- The benchmark used four fixed test studies, two of them with only 3 and 5 donors. The intervals describe variation among donors within these studies.
- Each method used one training seed, so the benchmark did not measure how results vary across different seeds.
- In the main test sample, only 20 cells (all erythroid, the lineage that produces red blood cells) belonged to a type outside the reference. The three removed types were closely related immune types, and most of their test cells came from the extra rare-cell sample.
- The released models differ from the reference-trained methods in training data and cell-type vocabulary, so comparisons with them cannot isolate the effect of model design.
- Two automated model reviews (one of the methods, one of the paper) by one Claude Opus model session returned PASS. There has been no peer, human or external review.
- CellTypist trained on the reference was refitted with seed 0 after its first fits left out the random seed set in the protocol. A private reproduction of the refitted results was compared with the canonical run by the same pipeline: 1,521 checks, 0 gated breaches. The paper calls this an internal comparison. Nothing has been independently verified or replicated.
References
- Rewire Bio (2026). Annotation transfer and validation-selected abstention for held-out blood single-cell studies: a recorded benchmark of six matched and two released annotators. Manuscript draft, result version m5-seed0-v2. Not peer reviewed. Compiled PDF; source at revision fd4588c2b58eee214fea76b1874be1a37df1f0da.
- Rewire Bio (2026). Release study-v1-seed0-20261007. Release page; public evidence archive; M4 example archive (SHA-256
7b798df27f35440f5c2c01ab1f39f284896a31fb5229dd342393d914cd1cdf78). - Abdelaal, T. et al. A comparison of automatic cell identification methods for single-cell RNA sequencing data. Genome Biology 20, 194 (2019). https://doi.org/10.1186/s13059-019-1795-z
- Binvignat, M. et al. Single-cell RNA-Seq analysis reveals cell subsets and gene signatures associated with rheumatoid arthritis disease activity. JCI Insight 9, e178499 (2024). https://doi.org/10.1172/jci.insight.178499
- CZI Cell Science Program et al. CZ CELLxGENE Discover: a single-cell data platform for scalable exploration, analysis and modeling of aggregated data. Nucleic Acids Research 53, D886 to D900 (2025). https://doi.org/10.1093/nar/gkae1142
- Domínguez Conde, C. et al. Cross-tissue immune cell analysis reveals tissue-specific features in humans. Science 376, eabl5197 (2022). https://doi.org/10.1126/science.abl5197
- Fischer, F. et al. scTab: Scaling cross-tissue single-cell annotation models. Nature Communications 15, 6611 (2024). https://doi.org/10.1038/s41467-024-51059-5
- Gong, Q. et al. Multi-omic profiling reveals age-related immune dynamics in healthy adults. Nature 648, 696 (2025). https://doi.org/10.1038/s41586-025-09686-5
- Xu, C. et al. Probabilistic harmonization and annotation of single-cell transcriptomics data with deep generative models. Molecular Systems Biology 17, e9620 (2021). https://doi.org/10.15252/msb.20209620
Help improve this article
Found an error or a better source? Leave a note here, or highlight a passage to comment on it.